USD/JPY Price Analysis: Advances steadily, hits four-week high shy of 158.00
- USD/JPY rises to 157.67, driven by Federal Reserve's commitment to higher rates.
- Technical indicators show strong bullish momentum, with key resistance at 158.00.
- Intervention threats by Japanese authorities keep buyers cautious as pair advances.

The USD/JPY climbs to a four-week high yet it remains capped by intervention threats by Japanese authorities. Federal Reserve officials' tough stance on monetary policy, which was set to keep rates higher for longer, kept the US dollar bid. Therefore, the major rises some 0.30%, trading at 157.67.
USD/JPY Price Analysis: Technical outlook
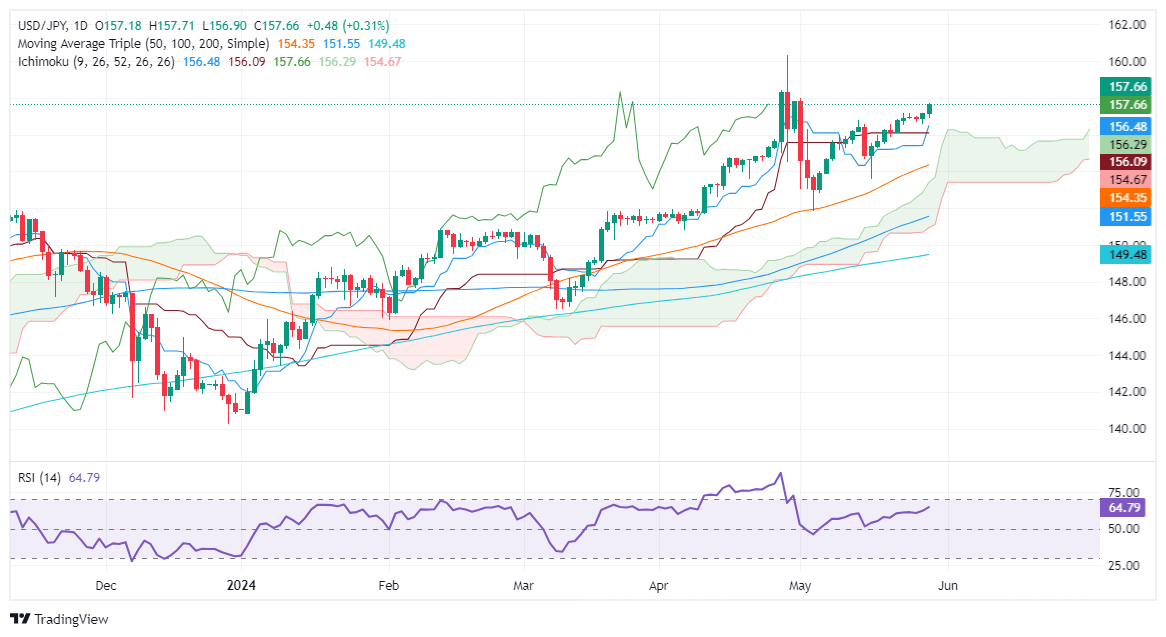
After breaching stir resistance at the May 23 high of 157.19, the USD/JPY resumed its uptrend, yet buyers seem cautious as the pair advances moderately toward the 158.00 mark. Momentum is still on the buyer’s side, with price action standing above the Ichimoku Cloud (Kumo), the Tenkan-Sen crossing above the Kijun-Sen, and the Relative Strength Index (RSI) standing at bullish territory.
On further strength, the USD/JPY could challenge 158.00. Once surpassed, the next stop would be the April 26 high of 158.44, ahead of 159.00. Further gains lie overhead, like the year-to-date (YTD) high of 160.32.
Conversely, if sellers moved in and pushed prices below the 157.00 figure, that could pave the way for further losses. In that event, support is seen at the Kijun-Sen at 156.48, followed by the Senkou Span A at 156.25, ahead of the Tenkan-Sen at 156.05.
USD/JPY Price Action – Daily Chart
Japanese Yen PRICE Today
The table below shows the percentage change of Japanese Yen (JPY) against listed major currencies today. Japanese Yen was the strongest against the Euro.
| USD | EUR | GBP | JPY | CAD | AUD | NZD | CHF | |
|---|---|---|---|---|---|---|---|---|
| USD | 0.49% | 0.47% | 0.30% | 0.48% | 0.50% | 0.36% | 0.13% | |
| EUR | -0.49% | -0.02% | -0.20% | -0.02% | 0.00% | -0.14% | -0.37% | |
| GBP | -0.47% | 0.02% | -0.18% | -0.01% | 0.02% | -0.10% | -0.34% | |
| JPY | -0.30% | 0.20% | 0.18% | 0.16% | 0.20% | 0.11% | -0.18% | |
| CAD | -0.48% | 0.02% | 0.01% | -0.16% | 0.03% | -0.11% | -0.35% | |
| AUD | -0.50% | -0.01% | -0.02% | -0.20% | -0.03% | -0.14% | -0.33% | |
| NZD | -0.36% | 0.14% | 0.10% | -0.11% | 0.11% | 0.14% | -0.24% | |
| CHF | -0.13% | 0.37% | 0.34% | 0.18% | 0.35% | 0.33% | 0.24% |
The heat map shows percentage changes of major currencies against each other. The base currency is picked from the left column, while the quote currency is picked from the top row. For example, if you pick the Japanese Yen from the left column and move along the horizontal line to the US Dollar, the percentage change displayed in the box will represent JPY (base)/USD (quote).
Author

Christian Borjon Valencia
FXStreet
Markets analyst, news editor, and trading instructor with over 14 years of experience across FX, commodities, US equity indices, and global macro markets.


