USD/JPY plunges as trade optimism fades and BoJ looms
- USD/JPY tumbles during North American trading, hovering near the bottom of its daily range around 142.00.
- Persistent trade uncertainty and fading multilateralism weigh on market sentiment; BoJ meeting and US economic data eyed.
- Key technical resistance levels are seen around 142.37, 142.94, and 143.18.

The USD/JPY pair faces heavy selling pressure, sliding to the 142.00 zone during Monday’s North American hours. Investor caution has resurfaced as broader trade optimism erodes, pushing demand toward the safe-haven Japanese Yen. Last week’s tentative rebound in risk sentiment had propelled USD/JPY back towards 144.00, but the start of this week sees renewed Yen strength ahead of key domestic and US events. Japanese markets remained closed on Monday for Showa Day, yet attention is firmly on the upcoming BoJ meeting where policymakers are expected to hold rates at 0.50%. However, Tokyo’s Consumer Price Index (CPI) excluding fresh food surged 3.4% year-over-year in March, hinting at persistent inflationary pressures that could push the BoJ closer to tightening later this year.
Meanwhile, the US Dollar struggles amid stagnant trade negotiations. Despite Treasury Secretary Bessent’s comments on potential progress with Asian countries and hopes of China de-escalating, China firmly denied any ongoing talks, stressing mutual respect was essential. Retailers like Temu and Shein have already raised prices significantly for US consumers, reflecting the broader cost of persistent tariffs. Market participants are also looking ahead to a packed economic calendar, beginning with Wednesday’s first reading of Q1 US GDP, followed by Friday’s Nonfarm Payrolls report. Both releases could heavily influence the Fed's monetary policy trajectory, with expectations rising for rate cuts if economic deterioration persists into the second half of the year.
The move from multilateralism to bilateral negotiations under the Trump administration has introduced long-term structural uncertainties. While clients wonder if US trade policies could reduce global tariffs, history suggests prolonged instability. WTO obligations make unilateral tariff reductions difficult, and bilateral FTA negotiations are lengthy processes, typically taking years to conclude and implement. Adding to the complexity, China announced on Monday that it is not in active trade discussions with the US, emphasizing there are no winners in trade wars. As a consequence, economic spillovers are intensifying, with consumer prices rising sharply in sectors like retail. On the US front, DXY remains locked in a tight range near 100.00, awaiting fresh directional cues from this week's data releases. Resistance for the DXY is pegged at 100.22 and 101.90, while downside support lies at 97.73 and 96.94. Investors are cautious, weighing trade headlines and potential Fed policy shifts.
The BoJ’s meeting on Friday also holds major significance. Although rate hikes are not expected immediately, stronger-than-expected inflation readings and broader global trade disruptions may influence future guidance. Expectations for a BoJ rate hike have been pushed back to later this year, with market participants eyeing the September-December window. Overall, the Japanese Yen could strengthen further amid slower global growth and more accommodative policies from other major central banks, including the Fed, BoE, and ECB, all of which have signaled readiness to ease if economic risks escalate.
USD/JPY Technical Analysis
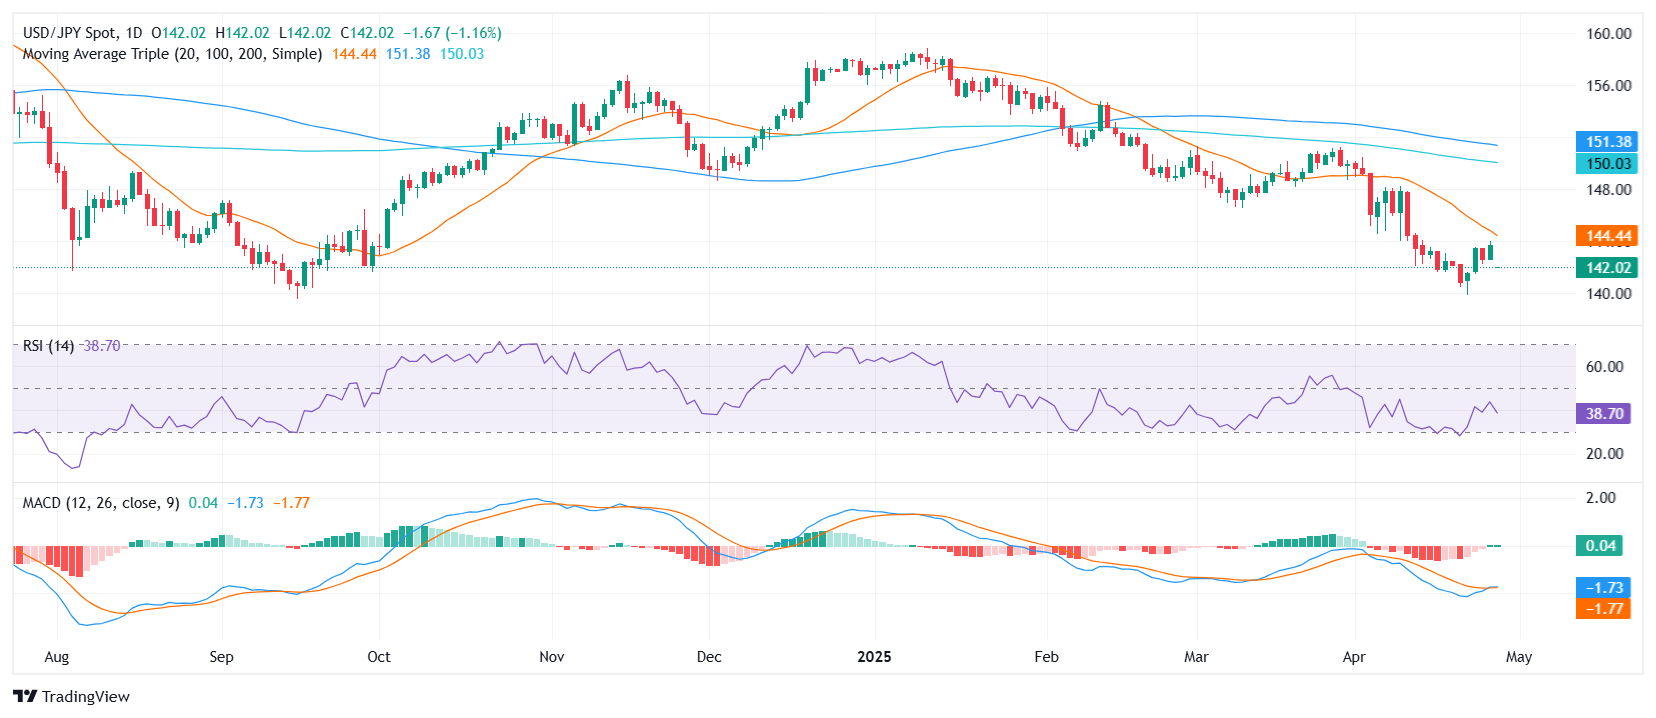
Technically, USD/JPY is displaying clear bearish signals as it trades around 142.00, down 1.14% on the day, and close to the bottom of its daily range between 141.98 and 143.89. The Relative Strength Index (RSI) at 38.71 is neutral, while the MACD offers a modest buy signal, creating a mixed but overall cautious technical backdrop. Adding to the bearish case, the Awesome Oscillator at −3.98 and Commodity Channel Index (CCI 20) at −52.62 both remain neutral, yet slanted negatively. Selling pressure is further reinforced by moving averages: the 20-day SMA sits at 144.40, the 100-day SMA at 151.24, and the 200-day SMA at 150.02 — all above the current price and signaling downward momentum. Shorter-term dynamics offer little relief, with the 10-day EMA at 142.94 and the 10-day SMA at 142.37 both presenting immediate resistance barriers. Key resistance levels to monitor are 142.37, followed by 142.94 and 143.18. A recovery above these hurdles would be necessary to weaken the current bearish momentum, but for now, risks remain tilted to the downside.
Daily Chart
Author

Patricio Martín
FXStreet
Patricio is an economist from Argentina passionate about global finance and understanding the daily movements of the markets.


