|

USD/JPY New York Price Forecast: Dollar slumps near four-week’s lows vs. yen

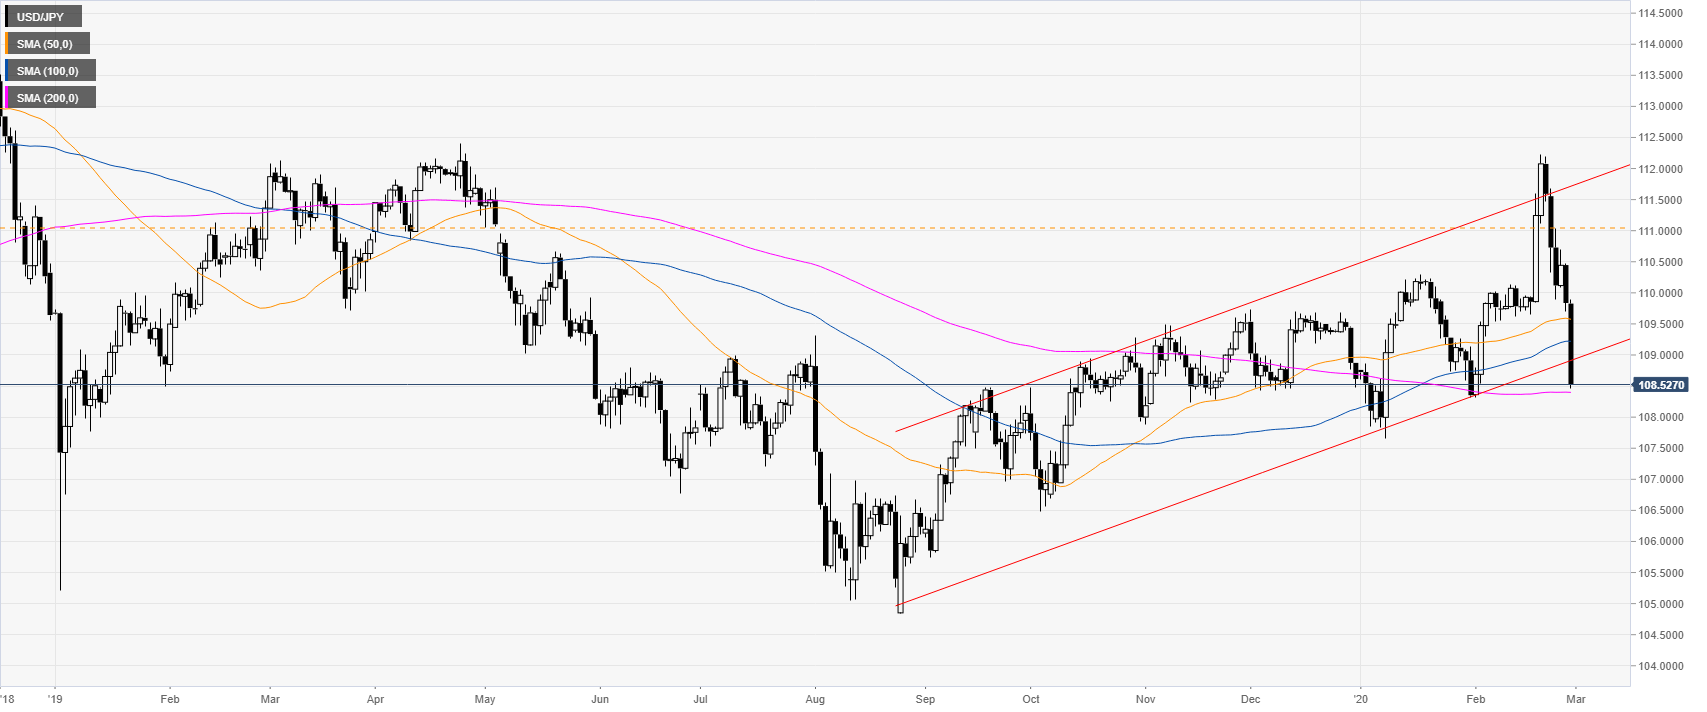
  • USD/JPY is dropping sharply below the 110.00 figure as the market is nearing the 200-day SMA.
  • The level to beat for bears is the 108.25 support.


USD/JPY daily chart

 
USD/JPY is reversing down sharply from the 2020 tops while nearing the 200-day simple moving averages (SMA). 
 

USD/JPY four-hour chart

 
USD/JPY lost about 150 pips since the New York close on Thursday. The spot remains weak as sellers remain in control. The market as potentially rooom to fall further towards 108.25, 107.65 and the 107.35 level the way down. Resistances can be expected near the 108.78 and 109.34 levels
 
 
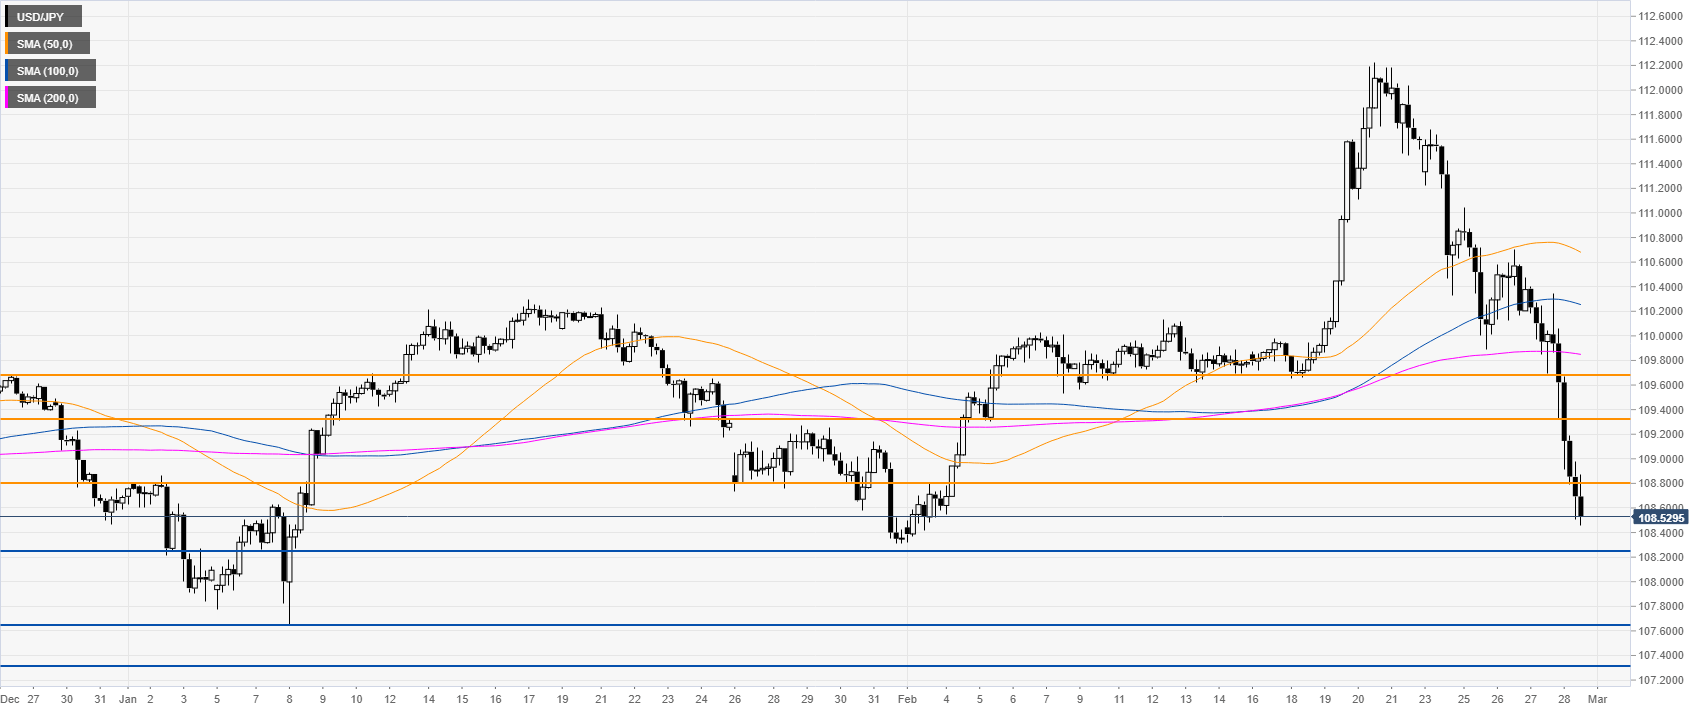
Resistance: 108.78, 109.34, 109.68
Support: 108.25, 107.65, 107.35


Additional key levels

USD/JPY

Overview
Today last price108.52
Today Daily Change-1.32
Today Daily Change %-1.20
Today daily open109.84
 
Trends
Daily SMA20110.05
Daily SMA50109.61
Daily SMA100109.23
Daily SMA200108.41
 
Levels
Previous Daily High110.47
Previous Daily Low109.69
Previous Weekly High112.23
Previous Weekly Low109.66
Previous Monthly High110.29
Previous Monthly Low107.65
Daily Fibonacci 38.2%109.99
Daily Fibonacci 61.8%110.18
Daily Pivot Point S1109.53
Daily Pivot Point S2109.22
Daily Pivot Point S3108.75
Daily Pivot Point R1110.31
Daily Pivot Point R2110.78
Daily Pivot Point R3111.09

Author

Flavio Tosti

Flavio Tosti

Independent Analyst


More from Flavio Tosti
Share:

Editor's Picks

EUR/USD seems fragile below 1.1700 as Middle East war boosts energy prices

The EUR/USD pair trades flat at around 1.1680 during the Asian trading session on Tuesday, but broadly seems vulnerable, being close to its five-week low. The major currency pair is under pressure as surging oil prices due to the United States-Israel war with Iran have increased the risks of higher inflation for the Old Continent.

GBP/USD hovers around 1.3400 with bearish pressure intact

GBP/USD edges higher after three days of losses, trading around 1.3400 during the Asian hours on Tuesday. The technical analysis of the daily chart indicates an ongoing bearish bias, as the pair trades within a descending channel pattern.

Gold sticks to gains above $5,350 amid sustained safe-haven demand; firmer USD caps gains

Gold sticks to its positive bias for the third straight day and trades above the $5,350 level heading into the European session on Tuesday. Concerns about a broader regional conflict in the Middle East continue to weigh on investors' sentiment and underpin demand for the traditional safe-haven bullion.

Stellar risks deeper losses as derivatives metrics turn negative

Stellar is trading red below $0.16 at the time of writing on Tuesday, after a slight recovery the previous day. Weakening derivatives data caps the recovery, while an unfavorable technical outlook projects a deeper correction for the XLM token in the upcoming days.

The market is not panicking it is repricing the probability distribution of Oil and time

At the end of the day, markets do not trade morality or geopolitics. They trade transmission channels. And the only channel that truly matters in this maelstrom runs through the price of energy and the time value of money.

Hyperliquid Price Forecast: HYPE rises on commodities demand amid US-Iran war

Hyperliquid (HYPE) steadies above $33 at press time on Tuesday, marking its fourth consecutive day of recovery in a broadly volatile market due to the ongoing US-Israel strikes on Iran.