|

USD/JPY Asia Price Forecast: Dollar remains vulnerable vs. yen, trades above 110.00 figure

  • USD/JPY is in consolidation mode following the recent drop. 
  • The level to beat for sellers is the 110.00 figure.
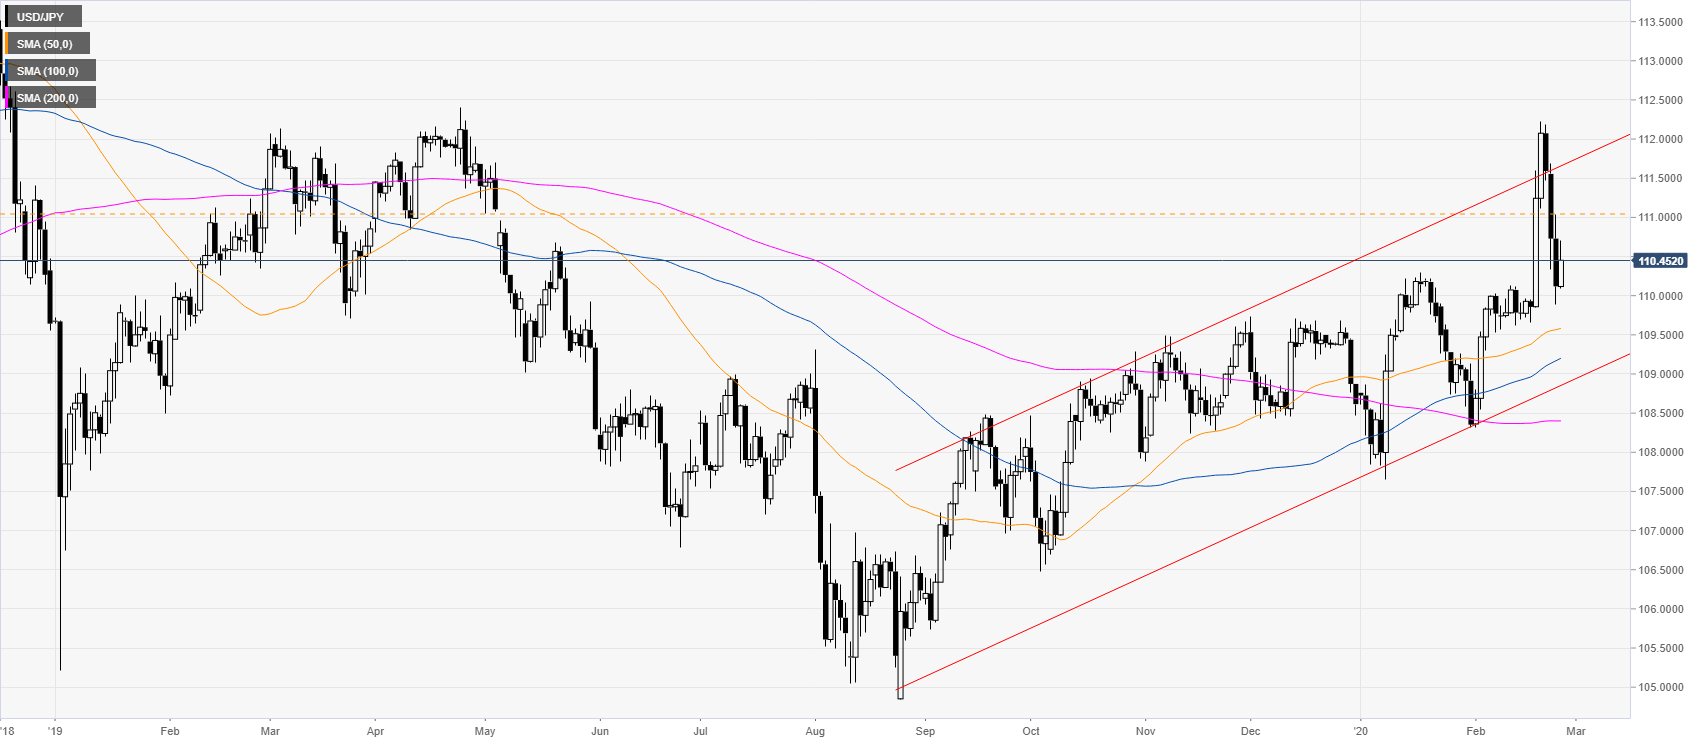


USD/JPY daily chart

 
USD/JPY is trading in an ascending channel while trading above the main daily simple moving averages (SMAs). The quote is retracing down after a huge breakout last week. 
 

USD/JPY four-hour chart

 
USD/JPY is consolidating the recent decline in the 110.00/110.60 band while trading between the 50 and the 100 SMAs. As the spot remains vulnerable to the downside, the sellers could pressure the 110.00 support for a drop towards the 109.40 and 108.60 on the way down. Resistances are seen near the 110.65 level and the 111.00 figure.
   
 
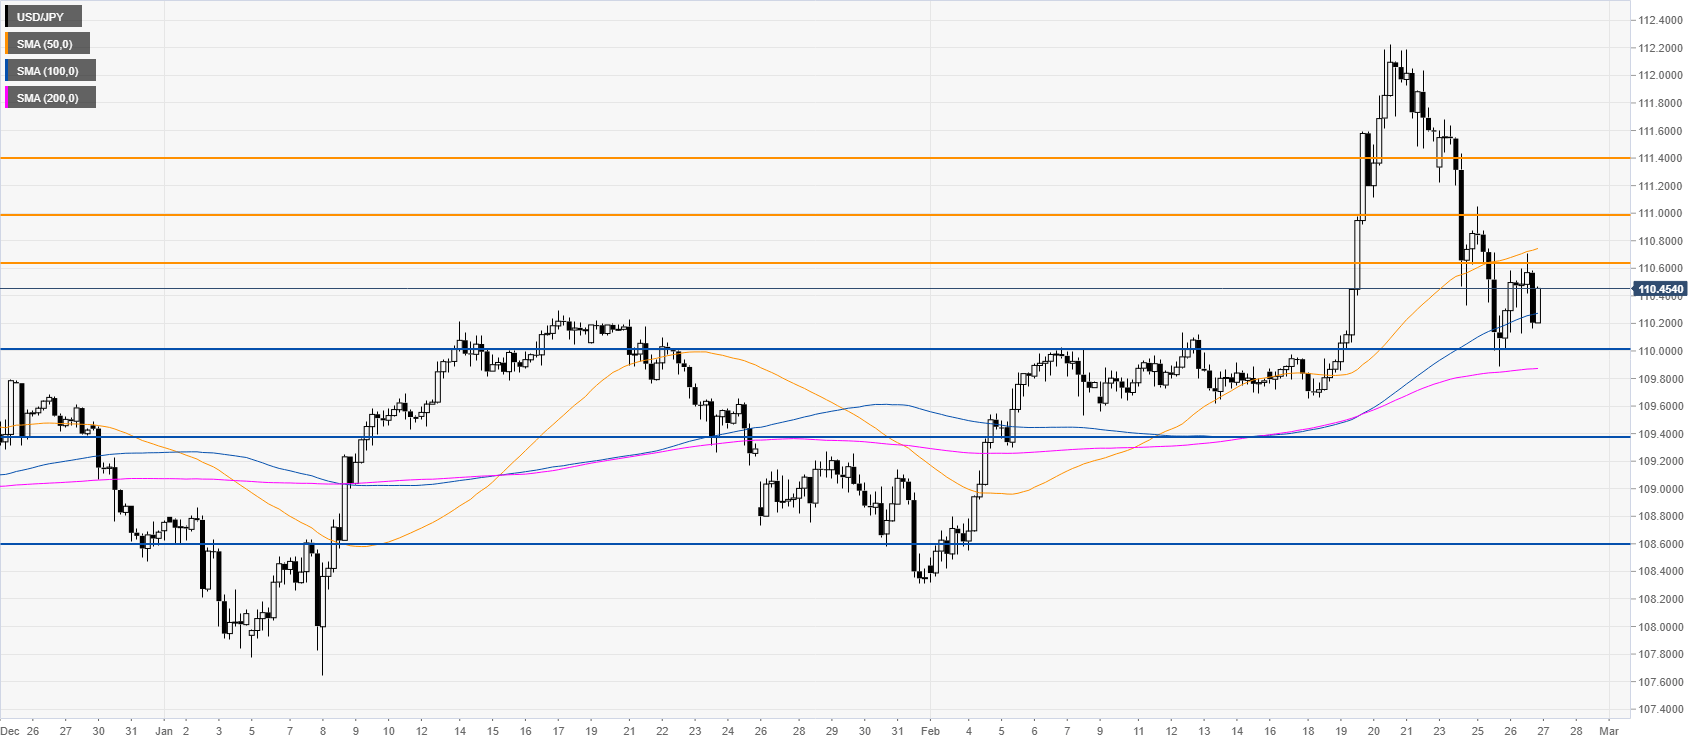
Resistance: 110.65, 111.00, 111.40
Support: 110.00, 109.40, 108.60


Additional key levels

USD/JPY

Overview
Today last price110.32
Today Daily Change0.20
Today Daily Change %0.18
Today daily open110.12
 
Trends
Daily SMA20109.94
Daily SMA50109.58
Daily SMA100109.18
Daily SMA200108.41
 
Levels
Previous Daily High111.04
Previous Daily Low109.89
Previous Weekly High112.23
Previous Weekly Low109.66
Previous Monthly High110.29
Previous Monthly Low107.65
Daily Fibonacci 38.2%110.33
Daily Fibonacci 61.8%110.6
Daily Pivot Point S1109.66
Daily Pivot Point S2109.2
Daily Pivot Point S3108.51
Daily Pivot Point R1110.81
Daily Pivot Point R2111.5
Daily Pivot Point R3111.96

Author

Flavio Tosti

Flavio Tosti

Independent Analyst


More from Flavio Tosti
Share:

Editor's Picks

EUR/USD eyes nine-day EMA barrier after rebounding from 1.1600

EUR/USD gains ground after registering modest losses in the previous session, trading around 1.1620 during the Asian hours on Friday. The technical analysis of the daily chart suggests an ongoing bearish bias as the pair remains within the descending channel pattern.

GBP/USD: Pound Sterling ticks up against US Dollar in countdown to US NFP

The Pound Sterling trades marginally higher to near 1.3365 against the US Dollar during the Asian trading session on Friday. The GBP/USD pair edges up as the US Dollar ticks down ahead of the United States Nonfarm Payrolls data for February, which will be published at 13:30 GMT.

Gold awaits US Nonfarm Payrolls for a clear directional impetus

Gold rebounds above $5,100 early Friday after testing the $5,050 level amid global sell-off. The US Dollar pulls back as profit-taking creeps in ahead of US labor data. For February. 21-day SMA holds amid bullish RSI; a daily closing above 61.8% Fibo is critical for Gold buyers.

Ethereum pull in $169M as validators pile in to stake ETH

US spot Ethereum exchange-traded funds recorded $169 million in net inflows on Wednesday, marking the largest daily intake in two months, according to SoSoValue data. The rise in inflows signals renewed institutional interest in Ethereum amid broader market volatility.

The market compass is pointing at a barrel of Oil

The Asian open is arriving with equities leaning the wrong way, and the reason is not complicated. The market’s compass needle has snapped firmly toward crude. In this tape, oil is not just another input price; it is the gravitational center around which every asset class is orbiting.

Ripple tests recovery strength amid steady ETF inflows, growing retail interest

Ripple (XRP) continues to demonstrate notable resilience as the cryptocurrency market navigates the persistent war in the Middle East after the United States (US) and Israel attacked Iran on Saturday.