|

USD/INR New York Price Forecast: Greenback holds above 75.00 figure vs. Indian rupee

  • USD/INR is starting May with a modest uptick on USD dynamics. 
  • The level to beat for bulls is the 76.00 figure. 
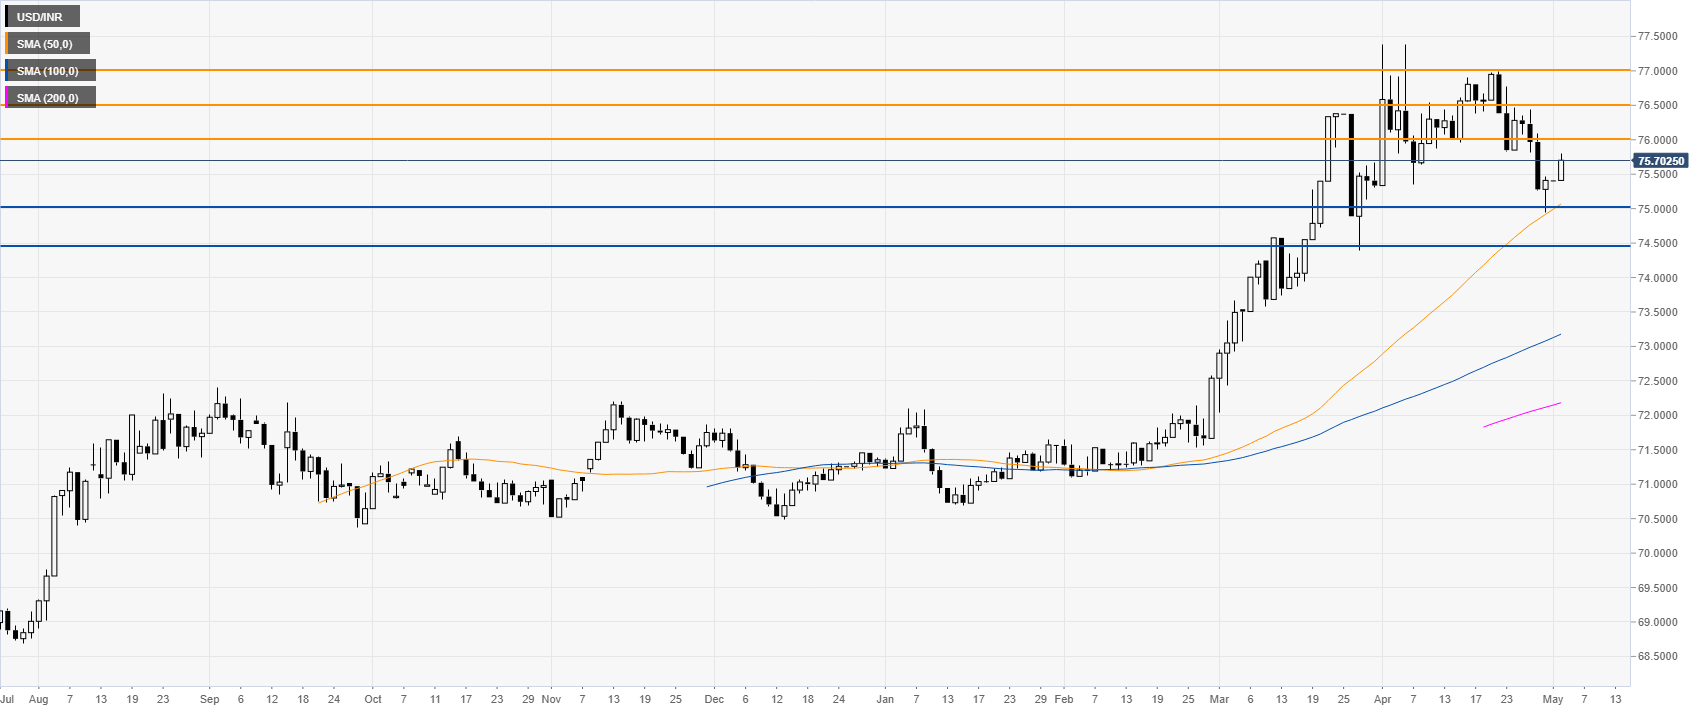
 

USD/INR daily chart


USD/INR bull trend remains intact as the spot is trading above the main SMAs while the market is consolidating near the 75.00 mark. Buyers remain in control and a break above the 76.00 figure can open the gates to more gains towards the 76.50 and 77.00 levels in the medium-term. On the flip side, support can be expected near the 75.00 and 74.50 price levels.  


Additional key levels

USD/INR

Overview
Today last price75.885
Today Daily Change0.0000
Today Daily Change %0.00
Today daily open75.885
 
Trends
Daily SMA2076.1303
Daily SMA5075.0277
Daily SMA10073.1623
Daily SMA20072.1755
 
Levels
Previous Daily High75.885
Previous Daily Low75.415
Previous Weekly High76.34
Previous Weekly Low75.14
Previous Monthly High76.975
Previous Monthly Low75.14
Daily Fibonacci 38.2%75.7055
Daily Fibonacci 61.8%75.5945
Daily Pivot Point S175.5717
Daily Pivot Point S275.2583
Daily Pivot Point S375.1017
Daily Pivot Point R176.0417
Daily Pivot Point R276.1983
Daily Pivot Point R376.5117

Author

Flavio Tosti

Flavio Tosti

Independent Analyst


More from Flavio Tosti
Share:

Editor's Picks

EUR/USD slumps below 1.1750 as USD benefits from risk-aversion

EUR/USD comes under renewed bearish pressure in the European session and trades below 1.1750 following a recovery attempt earlier in the day. The US Dollar gathers strength and weighs on the pair as investors seek refuge in the wake of Israel and the United States' joint attack on Iran.

GBP/USD targets 1.3500 barrier near moving averages

GBP/USD rebounds from the daily losses, trading around 1.3450 during the Asian hours on Monday. The technical analysis of the daily chart indicates an ongoing bearish bias, as the pair trades within a descending channel pattern.

Gold surges on safe-haven demand, tests $5,400

Gold benefits from intense risk-aversion on Monday and climbs to the $5,400 region, setting a fresh monthly-high in the process. Tensions in the Middle East remain high as Israel and Hezbollah continue to exchange strikes following the US-Israel joint attack on Iran over the weekend.

Bitcoin on brink of breakdown amid US-Iran war

Bitcoin (BTC) remains under pressure near the key support level of $65,700. Trading at $66,400 at the time of writing on Monday, a breakdown below this critical level would suggest a deeper correction ahead.

The week ahead: Conflict in the Middle East jolts markets

Events in the Middle East are obviously dominating financial markets this morning. The Brent crude oil price is extending gains and is higher by more than 8%, stock futures are pointing lower and the gold price is higher by more than 2%. 

Pi Network Price Forecast: Core team offloads supply, weighing on PI recovery

Pi Network  hovers below $0.1700, broadly steady at press time on Monday, attempting a recovery after a 2% loss the previous day. Sunday’s decline aligned with nearly 49 million PI tokens offloaded by the Pi Foundation, implying a spike in supply pressure that capped the prevailing four-day recovery.