|

USD Index Price Analysis: A deeper pullback is seen below 104.00

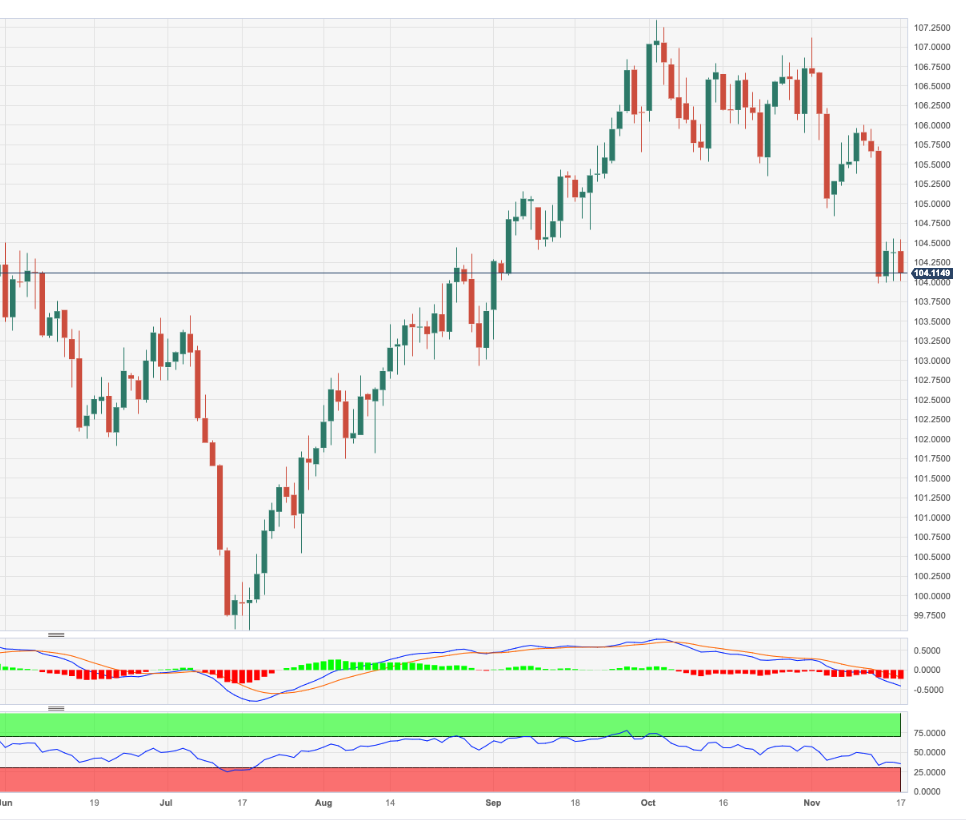
-  DXY resumes the decline and puts 104.00 to the test.

-  Extra losses appear on the cards on the breach of 104.00.


DXY reverses two consecutive daily advances and resumes the downward bias on Friday.

In case bears regain control, the breakdown of the November low of 103.98 (November 14-15) should pave the way for a quick test of the critical 200-day SMA at 103.61 prior to the weekly low of 102.96 (August 30).

In the meantime, while above the key 200-day SMA, the outlook for the index is expected to remain constructive.

DXY daily chart

Dollar Index Spot

Overview
Today last price104.12
Today Daily Change54
Today Daily Change %-0.25
Today daily open104.38
 
Trends
Daily SMA20105.75
Daily SMA50105.83
Daily SMA100104.19
Daily SMA200103.62
 
Levels
Previous Daily High104.56
Previous Daily Low104.01
Previous Weekly High106.01
Previous Weekly Low104.85
Previous Monthly High107.35
Previous Monthly Low105.35
Daily Fibonacci 38.2%104.35
Daily Fibonacci 61.8%104.22
Daily Pivot Point S1104.07
Daily Pivot Point S2103.77
Daily Pivot Point S3103.53
Daily Pivot Point R1104.62
Daily Pivot Point R2104.86
Daily Pivot Point R3105.17

Author

Pablo Piovano

Born and bred in Argentina, Pablo has been carrying on with his passion for FX markets and trading since his first college years.

More from Pablo Piovano
Share:

Editor's Picks

EUR/USD holds ground near 1.1550 ahead of US Inflation data

EUR/USD is holding ground at around 1.1550 in the European session on Wednesday. The pair takes advantage of the profit-taking pullback in the US Dollar as traders reposition ahead of the critical US CPI inflation data. However, any upside attempts could be limited amid renewed US-Iran tensions.

GBP/USD keeps range near 1.3400, with eyes on US CPI

GBP/USD clings to minor recovery gains near 1.3400 in Wednesday's European trading, though it remains in a familiar range heading into the US CPI event risk. Traders keep an eye on developments around the Middle East crisis, which could ramp up volatility in the major.

Gold languishes near March low, below $4,200 as traders await US CPI report

Gold maintains its heavily offered tone through the first half of the European session and currently trades near its lowest level since March 23, around the $4,180-$4,175 region. Renewed hostilities between the US and Iran fuel inflationary concerns and bolster bets for more hawkish central banks.

Cardano's downtrend deepens despite on-chain bottoming signals

Cardano edges lower to $0.1600 signaling a potential extension of the 30% loss from last week. The altcoin remains under intense selling pressure, weighing on its retail support. Still, a spike in dormant supply re-entering circulation signals that the selling pressure has run its course, a pattern that often precedes a rebound.

US CPI data set to show inflation at three-year high in May, backing Fed hawkish tilt

The US Bureau of Labor Statistics will publish the May Consumer Price Index (CPI) data on Wednesday. The report is expected to show another step up in consumer inflation, driven by the persistently high Oil prices due to the ongoing crisis in the Middle East.

The US economy defies the rules: 100 days into the Oil shock and the recession signal is still missing

More than three months after the start of the Iran war and the resulting disruption to global energy markets, the US economy continues to display remarkable resilience. The conflict has triggered a sharp rise in Oil prices, reignited inflationary pressures and fueled widespread concerns about a potential economic slowdown.