|

USD/IDR Price Analysis: Two-week-old falling trendline caps immediate upside

  • USD/IDR fails to hold onto recovery gains from the multi-month low.
  • Weak RSI levels can trigger another bounce.
  • 21-day SMA, eight-week-long trend line add to the resistance.

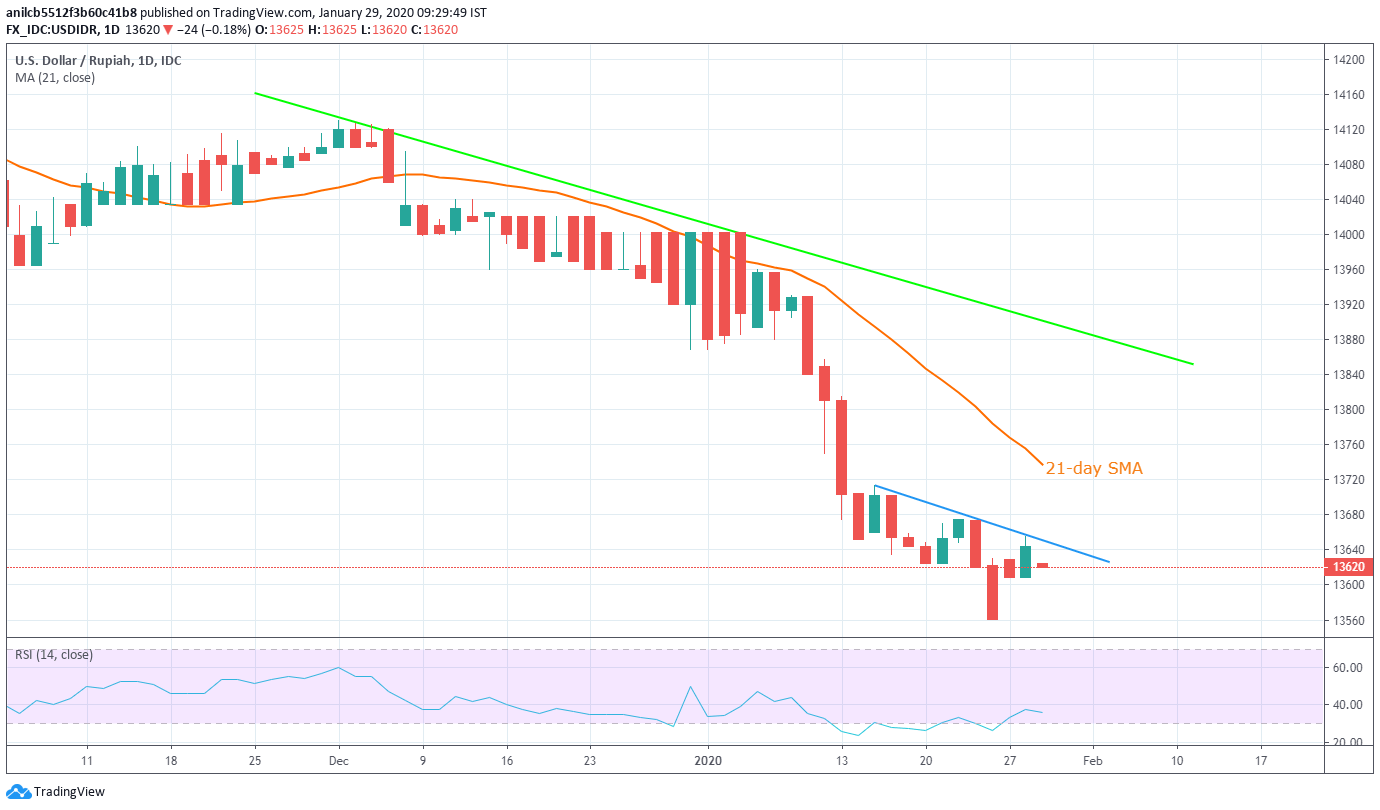
USD/IDR takes rounds to 13,620 during early Wednesday. The pair recently bounced off the lowest since February 2018 but failed to cross the short-term resistance line, which in turn increases the odds of the pair’s further weakness.

While 13,600 and the recent low near 13,560 can please the bears during further declines, 13,450 and the year 2018 bottom close to 13,255 may mark their presence afterward.

On the upside, a clear break of 13,650, comprising the immediate resistance line, could push the USD/IDR prices towards a 21-day SMA level of 13,737.

However, pair’s further recovery past-13,737 needs to conquer a falling trend line since early-December, around 13,900 now, to lure the bulls.

USD/IDR daily chart

Trend: Bearish

Additional important levels

Overview
Today last price13628
Today Daily Change-12.5000
Today Daily Change %-0.09%
Today daily open13640.5
 
Trends
Daily SMA2013747.0483
Daily SMA5013907.0849
Daily SMA10014000.533
Daily SMA20014105.5042
 
Levels
Previous Daily High13720.5
Previous Daily Low13217.378
Previous Weekly High13716
Previous Weekly Low13521.5
Previous Monthly High14181.2945
Previous Monthly Low13676.9335
Daily Fibonacci 38.2%13409.5706
Daily Fibonacci 61.8%13528.3074
Daily Pivot Point S113331.752
Daily Pivot Point S213023.004
Daily Pivot Point S312828.63
Daily Pivot Point R113834.874
Daily Pivot Point R214029.248
Daily Pivot Point R314337.996

Author

Anil Panchal

Anil Panchal

FXStreet

Anil Panchal has nearly 15 years of experience in tracking financial markets. With a keen interest in macroeconomics, Anil aptly tracks global news/updates and stays well-informed about the global financial moves and their implications.

More from Anil Panchal
Share:

Editor's Picks

EUR/USD flirts with daily highs, retargets 1.1900

EUR/USD regains upside traction, returning to the 1.1880 zone and refocusing its attention to the key 1.1900 barrier. The pair’s slight gains comes against the backdrop of a humble decline in the US Dollar as investors continue to assess the latest US CPI readings and the potential Fed’s rate path.

GBP/USD remains well bid around 1.3650

GBP/USD maintains its upside momentum in place, hovering around daily highs near 1.3650 and setting aside part of the recent three-day drop. Cable’s improved sentiment comes on the back of the Greenback’s  irresolute price action, while recent hawkish comments from the BoE’s Pill also collaborate with the uptick.

Gold clings to gains just above $5,000/oz

Gold is reclaiming part of the ground lost on Wednesday’s marked decline, as bargain-hunters keep piling up and lifting prices past the key $5,000 per troy ounce. The precious metal’s move higher is also underpinned by the slight pullback in the US Dollar and declining US Treasury yields across the curve.

Crypto Today: Bitcoin, Ethereum, XRP in choppy price action, weighed down by falling institutional interest 

Bitcoin's upside remains largely constrained amid weak technicals and declining institutional interest. Ethereum trades sideways above $1,900 support with the upside capped below $2,000 amid ETF outflows.

Week ahead – Data blitz, Fed Minutes and RBNZ decision in the spotlight

US GDP and PCE inflation are main highlights, plus the Fed minutes. UK and Japan have busy calendars too with focus on CPI. Flash PMIs for February will also be doing the rounds. RBNZ meets, is unlikely to follow RBA’s hawkish path.

Ripple Price Forecast: XRP potential bottom could be in sight

Ripple edges up above the intraday low of $1.35 at the time of writing on Friday amid mixed price actions across the crypto market. The remittance token failed to hold support at $1.40 the previous day, reflecting risk-off sentiment amid a decline in retail and institutional sentiment.