USD/CNH Price Analysis: Hovers around 7.1700 due to caution ahead of US-China trade talks
- USD/CNH could find the immediate support at the nine-day EMA of 7.1680.
- The 14-day Relative Strength Index is positioned below the 50 level, indicating a prevailing bearish bias.
- The primary barrier appears at the upper boundary of the descending channel around 1.1840.

The USD/CNH pair holds its ground for the third successive session, trading around 7.1690 during the Asian hours on Monday. The pair moves littles as traders adopt caution ahead of meeting between US Treasury Secretary Scott Bessent and Chinese Vice Premier He Lifeng due on Monday in Stockholm.
US and China are expected to extend their tariff truce by another three months, according to a source cited by the South China Morning Post (SCMP) on Sunday. The US has reportedly frozen export controls on key technologies to China in an effort to maintain smoother trade relations, according to a source cited by the Financial Times.
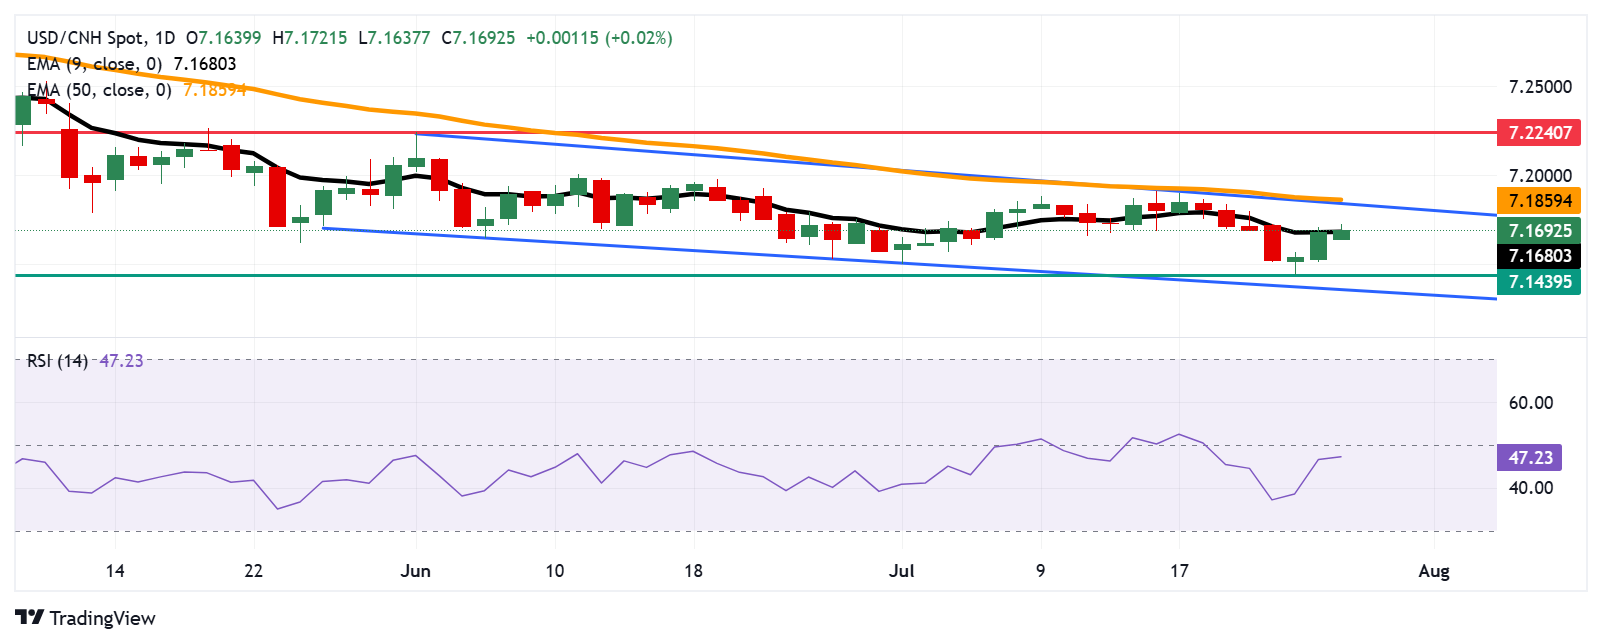
An analysis of the daily chart indicates that the pair moves downwards within a descending channel pattern, suggesting a bearish bias. The 14-day Relative Strength Index (RSI), a key momentum indicator, remains below the 50 level, suggesting a persistent bearish bias. However, the USD/CNH pair moves above the nine-day Exponential Moving Average (EMA), suggesting that short-term price momentum is strengthening.
On the downside, the nine-day EMA at 7.1680 is acting as an immediate support. A break below this level would weaken the short-term price momentum and put downward pressure on the USD/CNH pair to navigate the region around the eight-month low at 7.1439, which was recorded on July 24, followed by the descending channel’s lower boundary around 7.1360.
The USD/CNH pair could approach the upper boundary of the descending channel around 1.1840, followed by the 50-day EMA of 7.1859. A break above this crucial resistance zone would strengthen the medium-term price momentum and lead the pair to explore the region around the two-month high of 7.2240, reached on June 2.
USD/CNH: Daily Chart
Author

Akhtar Faruqui
FXStreet
Akhtar Faruqui is a Forex Analyst based in New Delhi, India. With a keen eye for market trends and a passion for dissecting complex financial dynamics, he is dedicated to delivering accurate and insightful Forex news and analysis.


