|

USD/CHF technical analysis: Greenback loses steam against Swissy, trades near 0.9930 level

  • USD/CHF erased its intraday gains, settling near the 0.9930 level. 
  • Support is seen at the 0.9920 level.
 

USD/CHF daily chart

 
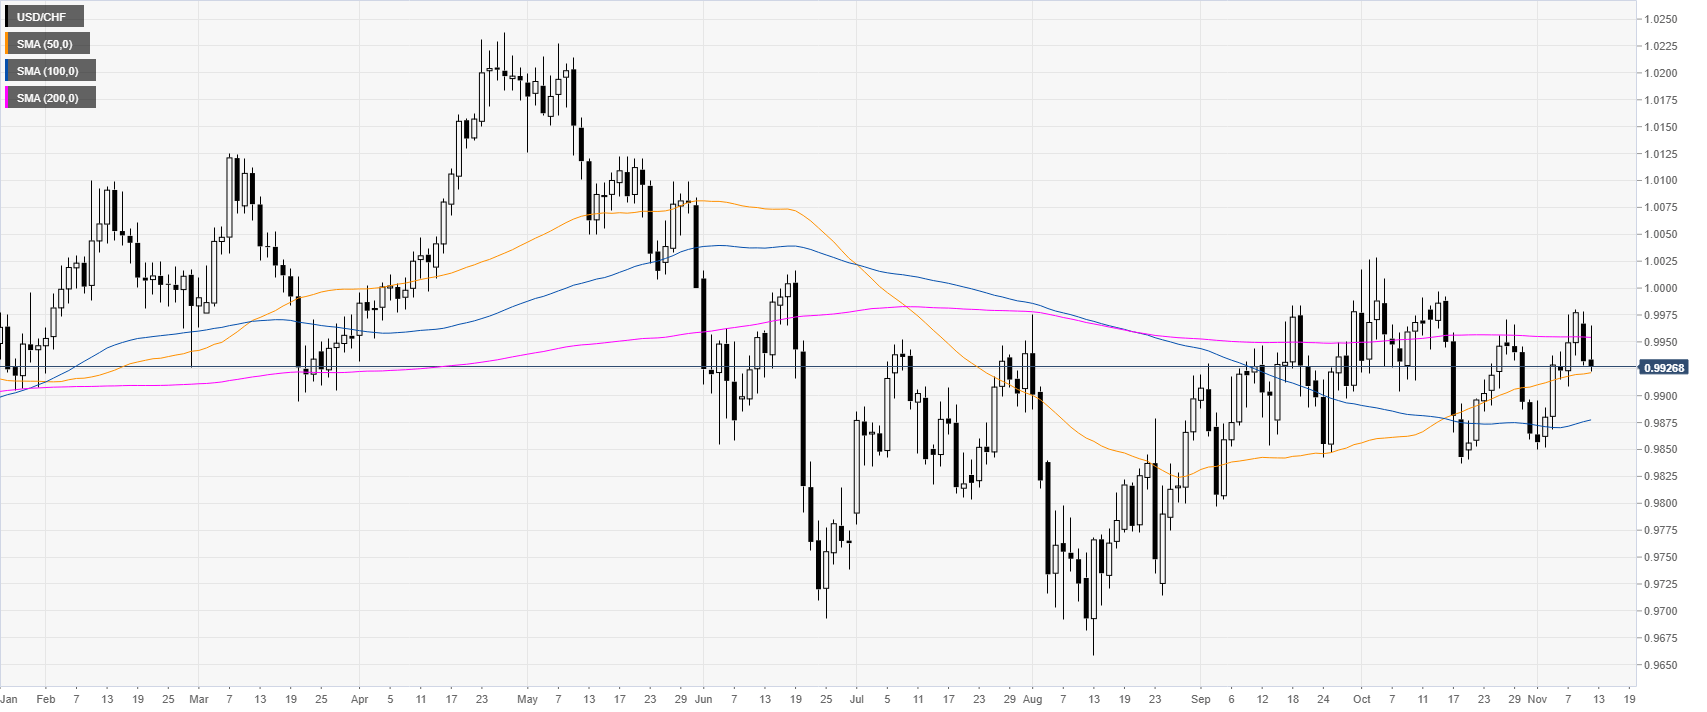
On the daily chart, USD/CHF is trading in a range below its 200-day simple moving average (DMA). The spot is holding just above the 50 SMA today at the 0.9921 level. 
 

USD/CHF four-hour chart

 
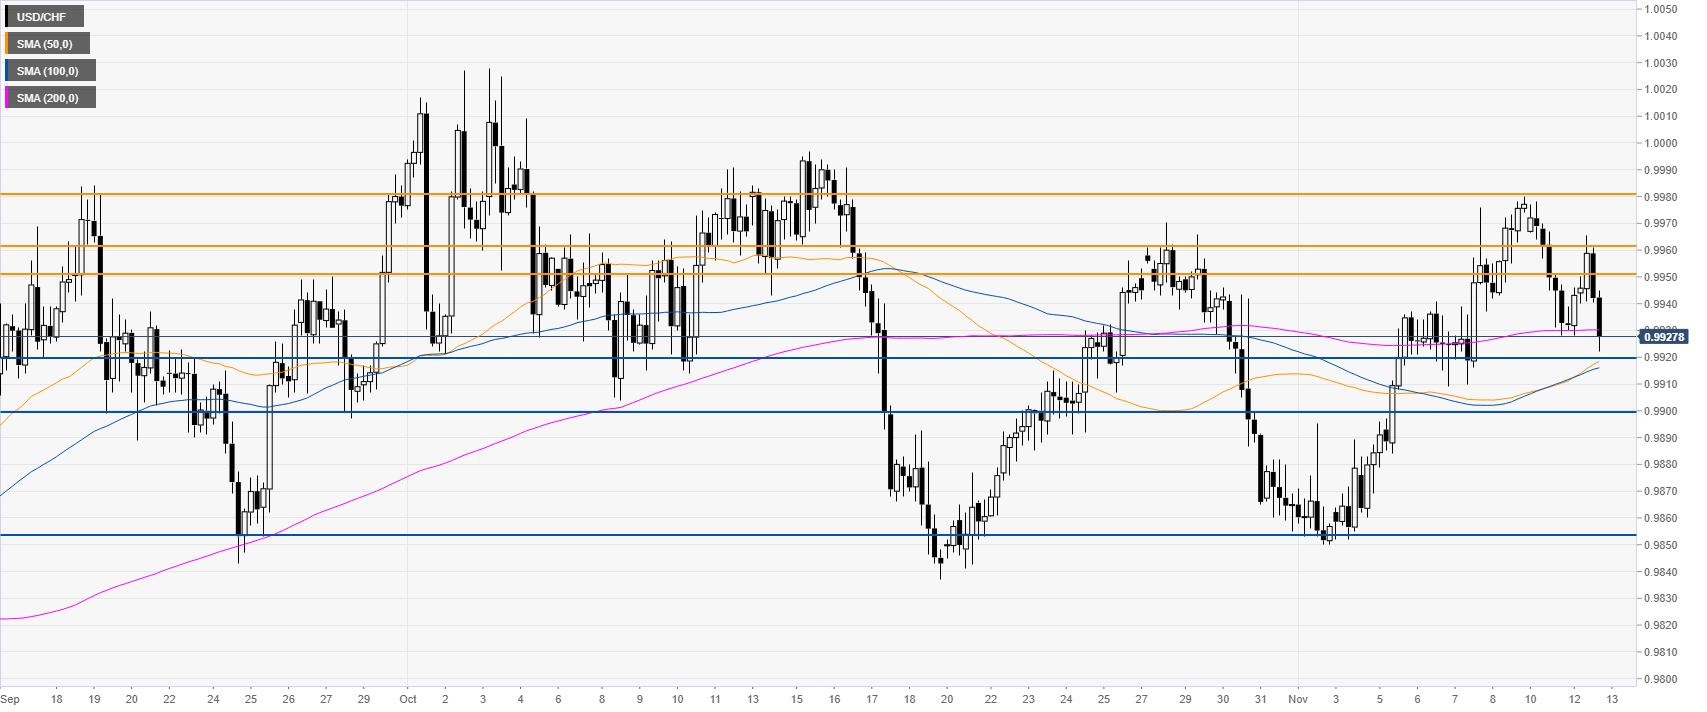
USD/CHF is retracing down from the current November highs while challenging the 0.9920 level and 200 SMA. If the buyers give up, the spot can continue to decline towards the 0.9899 and 0.9855 support levels, according to the Technical Confluences Indicator. 
 

USD/CHF 30-minute chart


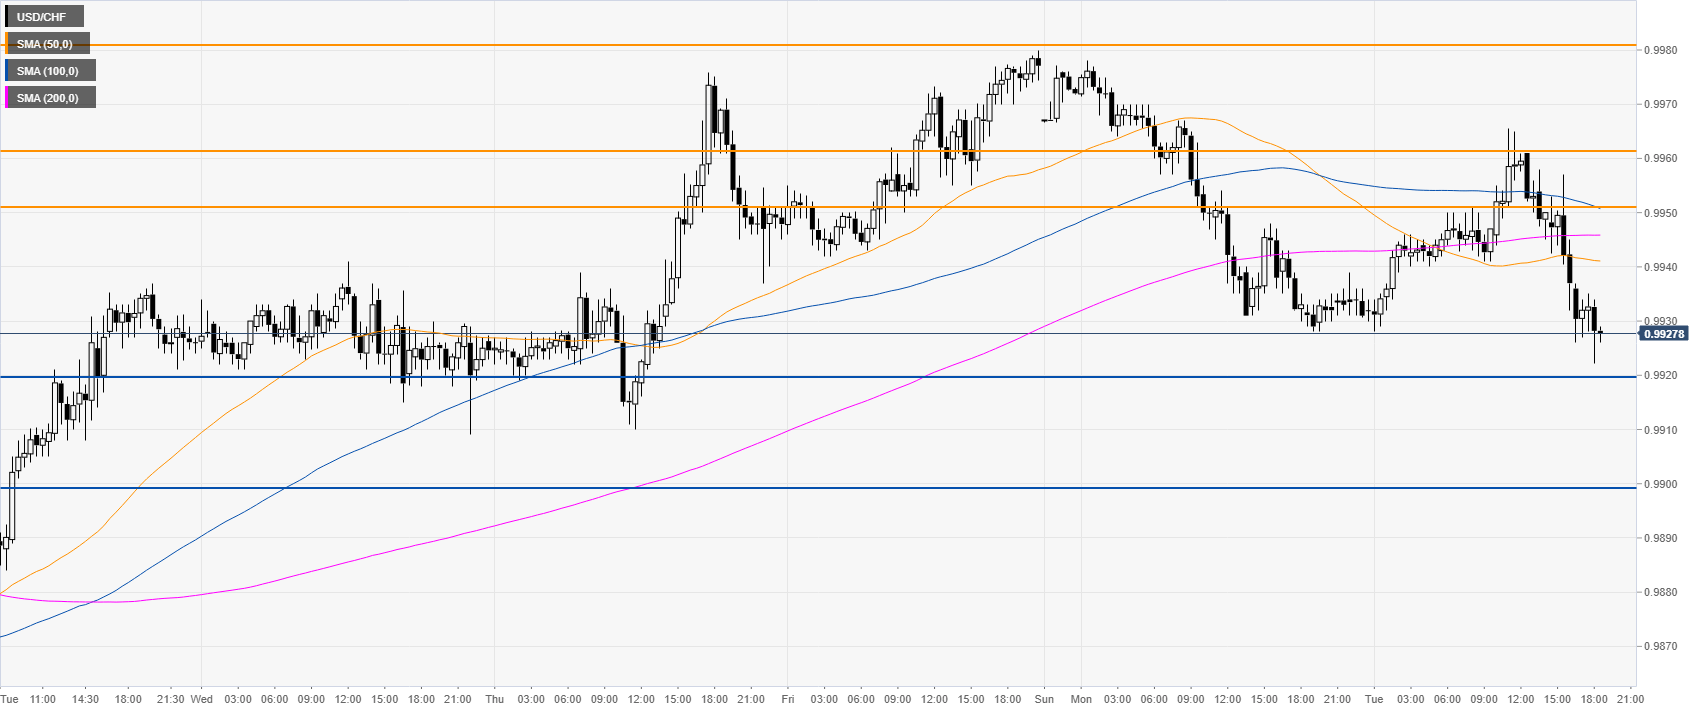
USD/CHF is trading below the main SMAs, suggesting a bearish bias in the short term. Resistance can be found near the 0.9951/61 zone and the 0.9982 level, according to the Technical Confluences Indicator. 
 

Additional key levels

USD/CHF

Overview
Today last price0.993
Today Daily Change-0.0002
Today Daily Change %-0.02
Today daily open0.9932
 
Trends
Daily SMA200.9914
Daily SMA500.992
Daily SMA1000.9876
Daily SMA2000.9955
 
Levels
Previous Daily High0.9978
Previous Daily Low0.9928
Previous Weekly High0.998
Previous Weekly Low0.9852
Previous Monthly High1.0028
Previous Monthly Low0.9837
Daily Fibonacci 38.2%0.9947
Daily Fibonacci 61.8%0.9959
Daily Pivot Point S10.9914
Daily Pivot Point S20.9896
Daily Pivot Point S30.9864
Daily Pivot Point R10.9964
Daily Pivot Point R20.9996
Daily Pivot Point R31.0014

Author

Flavio Tosti

Flavio Tosti

Independent Analyst


More from Flavio Tosti

Share:

Editor's Picks

AUD/USD stays defensive below 0.7150 after Chinese data

AUD/USD remains on the back foot below 0.7150 in the Asian session on Tuesday, close to an over three-week low touched the previous day. US bond yields hold near multi-year highs ahead of the FOMC meeting and oil-driven inflation risks, supporting the US Dollar and weighing on the currency pair. Mixed Chinese activity data for August also fail to inspire the Aussie.

USD/JPY extends gains toward 155.00 amid USD resurgence

USD/JPY keeps pushing higher toward 155.00 early Tuesday, looking for more upside, as traders await the FOMC and BoJ meetings this week. Meanwhile, Fed rate-hike bets and oil-driven inflation risks keep US bond yields near multi-year highs, supporting the US Dollar and the pair. That said, a more hawkish repricing of the BoJ normalization path might continue to underpin the Japanese Yen and could limit USD/JPY's upside. .

$4,275: Gold skating on thin ice as eyes remain on Mideast conflict, Fed

Gold is briefly regaining $4,300 early Tuesday, looking to build on a tepid recovery from six-week troughs near $4,250. Traders are monitoring the widening conflict in the Middle East ahead of the two-day US Federal Reserve monetary policy meeting later in the day.

Bitcoin remains volatile amid CLARITY Act vote – Zcash, Stellar rally

Bitcoin holds steady around $78,000 on Tuesday, sustaining its roughly 2% recovery from the previous day. Broader cryptocurrency market volatility remains elevated ahead of the scheduled CLARITY Act cloture vote on Tuesday. Zcash and Stellar retain bullish momentum, emerging as the top performers over the last 24 hours.

Hard assets are entering their next explosive phase – Are you positioned?
It’s official: Commodities and Hard Assets have become the best-performing asset class of 2026. In a year defined by persistent inflation, geopolitical conflict, rising sovereign debt and intensifying supply disruption, capital is rotating aggressively into the one area governments cannot print and central banks cannot manufacture: scarce physical assets.
Venezuela’s 65-billion-barrel Oil deal could reshape America’s inflation fight
The United States (US) has secured unprecedented access to part of Venezuela’s vast Oil reserves. The timing is particularly significant as the war with Iran is disrupting Middle Eastern supplies, keeping energy prices elevated and reviving concerns about inflation.
















