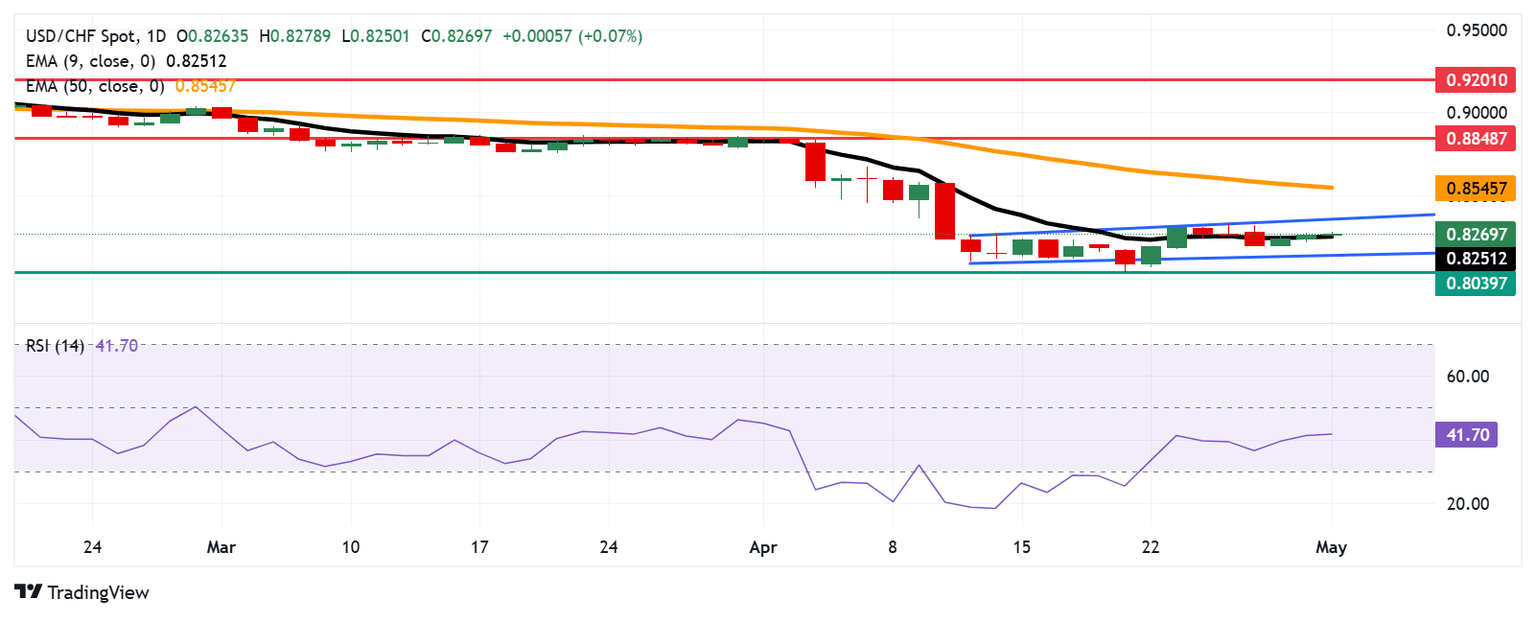
USD/CHF Price Forecast: Maintains position near 0.8250 near nine-day EMA support
- USD/CHF may approach immediate resistance at the upper boundary of its consolidation range around 0.8350.
- The 14-day RSI has moved above the 30 mark, signaling a continued short-term corrective rebound.
- A break below key support at the nine-day EMA of 0.8251 could weaken short-term momentum.

The USD/CHF pair holds ground for the third successive session, trading around 0.8270 during the Asian hours on Thursday. The daily chart suggests a neutral market bias, with the pair consolidating within a recently established rectangular pattern.
Additionally, USD/CHF remains near its nine-day Exponential Moving Average (EMA), indicating neutral short-term momentum. The 14-day Relative Strength Index (RSI) has climbed above 30, suggesting an ongoing short-term corrective rebound. However, as the RSI stays below the 50 threshold, the overall bearish trend remains intact.
On the upside, the USD/CHF pair may test immediate resistance at the upper edge of the consolidation range near 0.8350. A clear breakout above this level could trigger short-term bullish momentum, opening the door for a potential move toward the 50-day EMA at 0.8545. Additional resistance lies at the monthly high of 0.8848, marked on April 2.
Key support is found at the nine-day EMA of 0.8251. A break below this level may undermine short-term momentum, potentially pushing the USD/CHF pair toward the rectangle’s lower boundary at 0.8140. A further decline could reinforce bearish bias and pave the way for a retest of 0.8039 — the lowest level since November 2011, last seen on April 21.
USD/CHF: Daily Chart
Swiss Franc PRICE Today
The table below shows the percentage change of Swiss Franc (CHF) against listed major currencies today. Swiss Franc was the weakest against the New Zealand Dollar.
| USD | EUR | GBP | JPY | CAD | AUD | NZD | CHF | |
|---|---|---|---|---|---|---|---|---|
| USD | 0.16% | 0.22% | 0.52% | -0.02% | -0.01% | -0.15% | 0.10% | |
| EUR | -0.16% | 0.07% | 0.36% | -0.22% | -0.17% | -0.31% | -0.07% | |
| GBP | -0.22% | -0.07% | 0.27% | -0.26% | -0.24% | -0.38% | -0.17% | |
| JPY | -0.52% | -0.36% | -0.27% | -0.56% | -0.52% | -0.72% | -0.51% | |
| CAD | 0.02% | 0.22% | 0.26% | 0.56% | 0.03% | -0.13% | 0.10% | |
| AUD | 0.00% | 0.17% | 0.24% | 0.52% | -0.03% | -0.14% | 0.08% | |
| NZD | 0.15% | 0.31% | 0.38% | 0.72% | 0.13% | 0.14% | 0.22% | |
| CHF | -0.10% | 0.07% | 0.17% | 0.51% | -0.10% | -0.08% | -0.22% |
The heat map shows percentage changes of major currencies against each other. The base currency is picked from the left column, while the quote currency is picked from the top row. For example, if you pick the Swiss Franc from the left column and move along the horizontal line to the US Dollar, the percentage change displayed in the box will represent CHF (base)/USD (quote).
BRANDED CONTENT
Choosing a broker that aligns with your trading needs can significantly impact performance. Our list of the best regulated brokers highlights the best options for seamless and cost-effective trading.
Author

Akhtar Faruqui
FXStreet
Akhtar Faruqui is a Forex Analyst based in New Delhi, India. With a keen eye for market trends and a passion for dissecting complex financial dynamics, he is dedicated to delivering accurate and insightful Forex news and analysis.


