|

USD/CHF Price Analysis: Retreats despite high US bond yields, forms bearish-harami pattern

  • USD/CHF retraces from four-week highs, trading at 0.8742, down 0.44% as USD dips even as Treasury bond yields remain elevated.
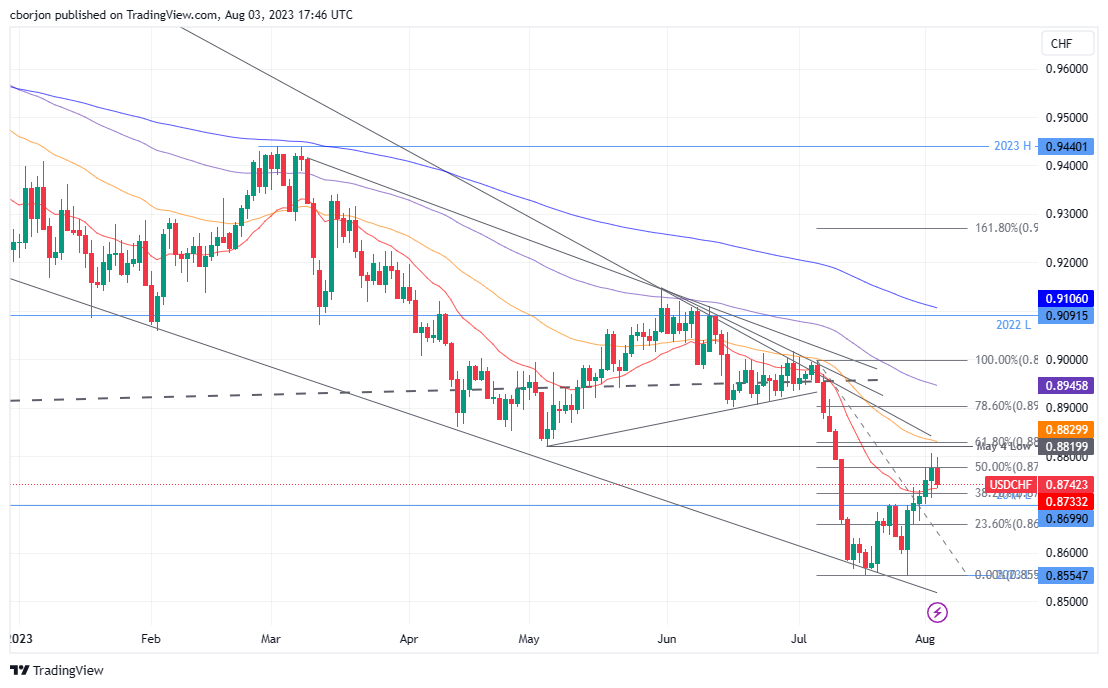
  • Formation of a ‘bearish-harami’ two-candle chart pattern indicates potential further downside, with key support levels at 0.8733 (20-day EMA), 0.8724 (38.2% Fib), and 0.8700.
  • If buyers prevail, resistance levels to watch are 0.8776 (50% Fib), 0.8805 (week’s high), and 0.8828 (61.8% Fib).

USD/CHF retraces as the US Dollar (USD) dips, despite US Treasury bond yields remaining high as market participants prepare for Friday’s US Nonfarm Payrolls report. Sentiment has shifted and is mixed, hence the greenback’s sudden weakness after hitting a new four-week high of 102.843, as shown by the US Dollar Index (DXY). At the time of writing, the USD/CHF is trading at 0.8742, down 0.44%.

USD/CHF Price Analysis: Technical outlook

From a daily chart perspective, the USD/CHF is forming a ‘bearish-harami’ two-candle chart pattern, which warrants further downside is expected, but support emerging at the 20-day Exponential Moving Average (EMA) at 0.8733, could hurt sellers’ plans for lower prices. If that scenario plays out, the USD/CHF next support to challenge would be the 38.2% Fibonacci (Fib) retracement at 0.8724, followed by the August 2 daily low of 0.8713, ahead of the 0.8700 figure.

On the other hand, if USD/CHF buyers move in, technical resistance emerges at the 50% Fib level at 0.8776, which, once cleared, will expose the current week’s high of 0.8805. A breach of the latter, the USD/CHF would rally toward the 61.8% Fib retracement at 08828.

USD/CHF Price Action – Daily chart

USD/CHF Daily chart

USD/CHF

Overview
Today last price0.8749
Today Daily Change-0.0026
Today Daily Change %-0.30
Today daily open0.8775
 
Trends
Daily SMA200.8702
Daily SMA500.8886
Daily SMA1000.8955
Daily SMA2000.9167
 
Levels
Previous Daily High0.8806
Previous Daily Low0.8718
Previous Weekly High0.8737
Previous Weekly Low0.8552
Previous Monthly High0.9005
Previous Monthly Low0.8552
Daily Fibonacci 38.2%0.8772
Daily Fibonacci 61.8%0.8752
Daily Pivot Point S10.8727
Daily Pivot Point S20.8678
Daily Pivot Point S30.8639
Daily Pivot Point R10.8815
Daily Pivot Point R20.8854
Daily Pivot Point R30.8903
 

Author

Christian Borjon Valencia

Christian Borjon began his career as a retail trader in 2010, mainly focused on technical analysis and strategies around it. He started as a swing trader, as he used to work in another industry unrelated to the financial markets.

More from Christian Borjon Valencia
Share:

Markets move fast. We move first.

Orange Juice Newsletter brings you expert driven insights - not headlines. Every day on your inbox.

By subscribing you agree to our Terms and conditions.

Editor's Picks

EUR/USD bounces toward 1.1750 as US Dollar loses strength

EUR/USD returned to the 1.1750 price zone in the American session on Friday, despite falling Wall Street, which indicates risk aversion. Trading conditions remain thin following the New Year holiday and ahead of the weekend, with the focus shifting to US employment and European data scheduled for next week.

GBP/USD nears 1.3500, holds within familiar levels

After testing 1.3400 on the last day of 2025, GBP/USD managed to stage a rebound. Nevertheless, the pair finds it difficult to gather momentum and trades with modest intraday gains at around 1.3490 as market participants remain in holiday mood.

Gold trims intraday gains, approaches $4,300

Gold retreated sharply from the $4,400  area and trades flat for the day in the $4,320 price zone. Choppy trading conditions exacerbated the intraday decline, although XAU/USD bearish case is out of the picture, considering growing expectations for a dovish Fed and persistent geopolitical tensions.

Cardano gains early New Year momentum, bulls target falling wedge breakout

Cardano kicks off the New Year on a positive note and is extending gains, trading above $0.36 at the time of writing on Friday. Improving on-chain and derivatives data point to growing bullish interest, while the technical outlook keeps an upside breakout in focus.

Economic outlook 2026-2027 in advanced countries: Solidity test

After a year marked by global economic resilience and ending on a note of optimism, 2026 looks promising and could be a year of solid economic performance. In our baseline scenario, we expect most of the supportive factors at work in 2025 to continue to play a role in 2026.

Crypto market outlook for 2026

Year 2025 was volatile, as crypto often is.  Among positive catalysts were favourable regulatory changes in the U.S., rise of Digital Asset Treasuries (DAT), adoption of AI and tokenization of Real-World-Assets (RWA).