|

USD/CHF Price Analysis: Positive divergence at a 4-hour chart could cap a move towards 0.9000

  • USD/CHF slumps to fresh three-month lows, beneath 0.9100.
  • Broad US Dollar weakness across the board weighed on the USD/CHF.
  • USD/CHF: The pair trades within a bearish flag, but USD bulls need to reclaim 0.9150.
  • USD/CHF: In the 4-hour chart, a positive divergence between price action and RSI indicates the pair could be headed to the upside.

The USD/CHF slides to fresh three-month lows, down 0.70%, trading at 0.9095 during the New York session at the time of writing. Mild risk-off market sentiment has kept the USD weaker across the board, except for risk-sensitive currencies, like the AUD and the GBP.

The US Dollar Index, which tracks the performance against a basket of six peers, declines 0.25%, down to 93.89, while the US 10-year Treasury yield remains flat at 1.558%. Furthermore, investors seem convinced that the Fed would hike rates by the beginning of the second half of 2022, 

USD/CHF Price Forecast: Technical outlook

Daily chart
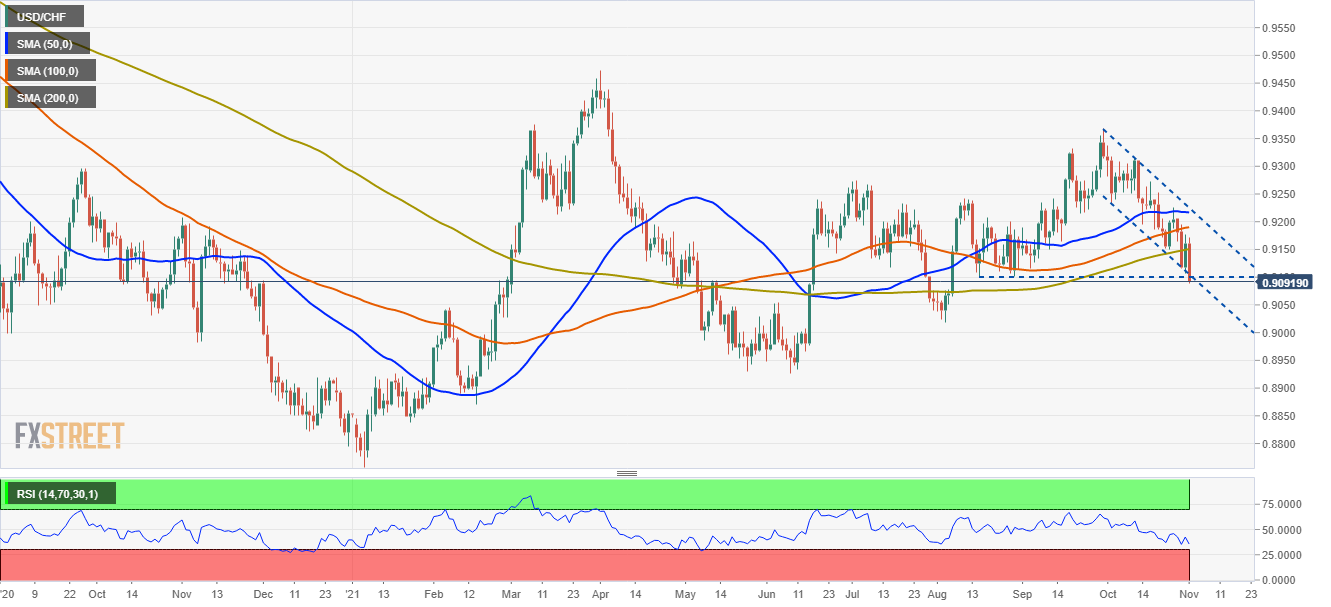
The USD/CHF is trading below the trend-setter 200-day moving average (DMA) which lies at 0.9147. Furthermore, the downward trend accelerated, pushing the pair towards the bottom trendline of a bullish flag channel, which would invalidate the pattern in case of being broken.

In the outcome of a downside break, the next support would be the August 4 low at 0.9018. A breach of the latter could send the pair tumbling towards the June 15 low at 0.8965.

Conversely, if USD bulls keep the price within the channel, they need a daily close above the 200-DMA around 0.9147. In that outcome, the immediate resistance would be the 100-DMA at 0.9186.

The Relative Strenght Index (RSI), a momentum indicator at 34, shows a slight positive divergence, which usually signals that the pair will reverse the recent downtrend to the upside.

4-hour chart
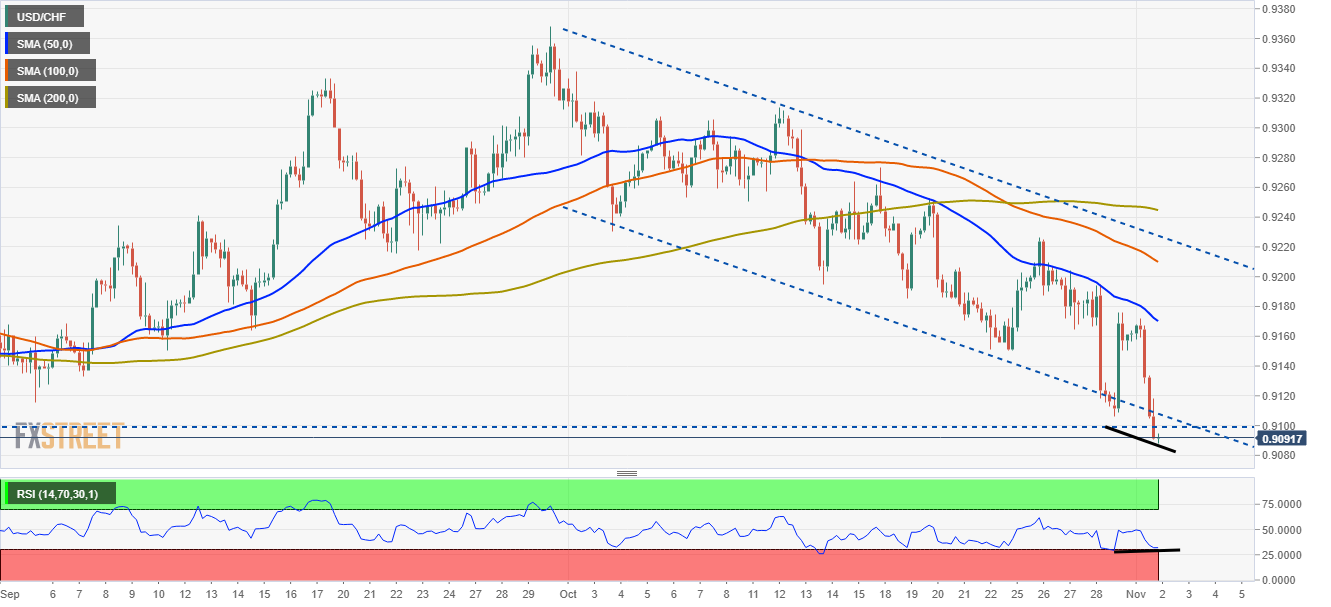
he USD/CHF 4-hour chart depicts the pair has a solid downward bias, represented by the simple moving averages (SMA’s) above the spot price and successive lower-highs and lower-lows development. However, the Relative Strength Index (RSI) at 32 shows a positive divergence, meaning that despite lower lows in price action, the RSI is printing higher lows,

indicating that the pair could move to the upside. Nevertheless, to confirm its validity, the USD/CHF needs to reclaim 0.9100.

USD/CHF TECHNICAL LEVELS

Overview
Today last price0.9091
Today Daily Change-0.0070
Today Daily Change %-0.76
Today daily open0.9161
 
Trends
Daily SMA200.9226
Daily SMA500.9217
Daily SMA1000.9189
Daily SMA2000.9149
 
Levels
Previous Daily High0.9176
Previous Daily Low0.9106
Previous Weekly High0.9226
Previous Weekly Low0.9106
Previous Monthly High0.9338
Previous Monthly Low0.9106
Daily Fibonacci 38.2%0.9149
Daily Fibonacci 61.8%0.9133
Daily Pivot Point S10.9119
Daily Pivot Point S20.9077
Daily Pivot Point S30.9049
Daily Pivot Point R10.919
Daily Pivot Point R20.9218
Daily Pivot Point R30.926

Author

Christian Borjon Valencia

Markets analyst, news editor, and trading instructor with over 14 years of experience across FX, commodities, US equity indices, and global macro markets.


More from Christian Borjon Valencia
Share:

Editor's Picks

AUD/USD meets fresh supply and tests 0.7100 amid weak Australian PMIs

AUD/USD has come under fresh selling pressure and is testing 0.7100 in the Asian session on Wednesday. Australia's flash PMIs showed manufacturing slipped into contraction and services expanding slowly for a second straight month, renewing the pair's downside. Furthermore, a bullish US Dollar acts as a headwind for the pair as traders keenly await the crucial Trump-Xi summit on Thursday. Meanwhile, markets shrug off US-Iran indirect talks.

USD/JPY stands firm near mid-157.00s, close to two-week high

USD/JPY hovers around mid-157.00s in the Asian session on Wednesday, near two-week highs touched last Friday as the BoJ's dovish rate hike continues to undermine the Japanese Yen. Meanwhile, the US Dollar remains firm amid the Fed's hawkish stance, adding support to the pair, though JPY intervention fears cap further gains. Markets pay little heed to the completion of the round of US-Iran indirect talks ahead of Trump-Xi meeting.

Gold approaches $4,300 as Fed hike bets boost USD to fresh high since late July

Gold extends its steady intraday slide through the first half of the European session, reversing a part of the previous day's recovery from sub-$4,300 levels. US Dollar buying remains unabated on the back of the Federal Reserve's hawkish outlook, which is seen as a key factor driving flows away from the non-yielding yellow metal.

Bitcoin outperforms US equities and Gold since mid-August
Bitcoin (BTC) extends its rally, trading above $86,000 at the time of writing on Wednesday after gaining more than 6% so far this week. Strong institutional demand is supporting BTC’s bullish price action, with spot Exchange Traded Funds (ETFs) recording over $714 million in inflows on Tuesday after nearly $1 billion in positive flows the previous day.
S&P Global PMIs expected to show resilient US economic growth in September
S&P Global will release on Wednesday its preliminary September Purchasing Managers' Indices (PMIs) for the United States, based on surveys of top private sector executives, to provide an early indication of economic momentum. The data is expected to highlight US economic resilience.
BoJ Recap: Not as hawkish as expected

The Bank of Japan (BoJ) raised its short-term interest-rate target to 1.25% from 1.00% in a 7-2 vote, marking another step in the normalisation of monetary policy and widely matching what everyone has been expecting for weeks.