Gold Price Forecast: XAU/USD drifts toward $4.300 with bears gaining traction
- XAU/USD nears $4.300 after rejection at $4,375 on Tuesday.
- The US Dollar appreciates across the board amid Fed tightening hopes and high US Treasury yields.
- The decline in Oil prices is providing some cushioning for Gold depreciation.

Gold (XAU/USD) retraces Tuesday’s gains on Wednesday and drifts lower, approaching the $4,300 area as the US Dollar Index (DXY) rallies further amid high US Treasury yields. Markets are still pondering the hawkish turn of the Federal Reserve (Fed) last week, while awaiting US business activity data to confirm monetary policy expectations, and keeping one eye on the UN summit in New York as US and Iran negotiate to reach a peace deal.
Investors' optimism about a positive outcome of the US-Iran talks has sent Oil prices tumbling this week, with the US benchmark WTI trading nearly 12% below last week’s highs, which is providing some support to precious metals. The DXY, however, keeps heading north and trades just below 101.00, its highest level in nearly two months, which is weighing heavily on Gold.
The focus this week is on the United Nations General Assembly, where US and Iranian officials are working on the sidelines to advance towards a peace deal. The US Special Envoy, Steve Wickoff, has confirmed that negotiations are going on, and US President Donald Trump affirmed on Tuesday that the US had ”a very good meeting, a very productive meeting” with Iranian officials, and that there was “a lot of momentum” towards an agreement.
Technical Analysis: Rangebound trading with bears gaining momentum
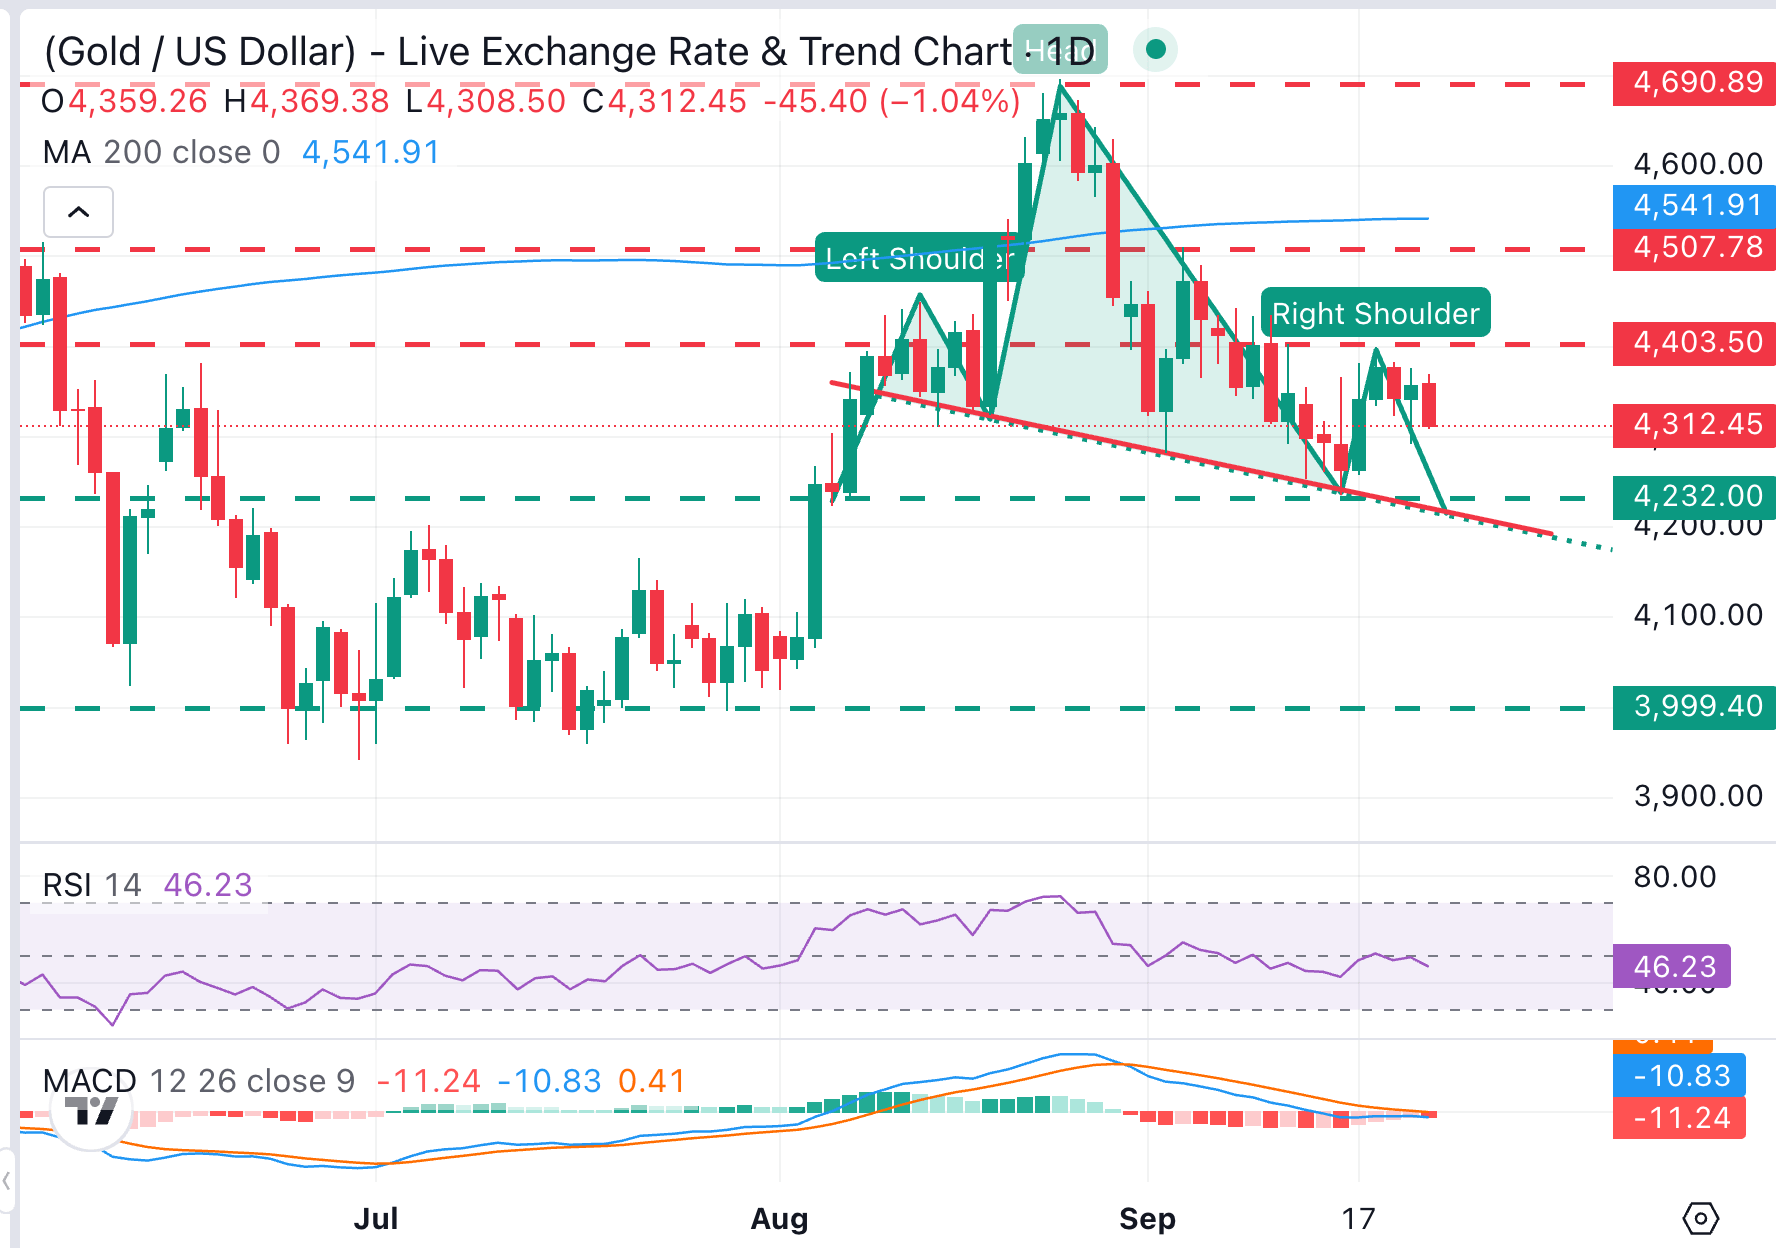
XAU/USD trades rangebound roughly between $4,300 and $4,400 with the immediate trend showing growing bearish momentum. Technical Indicators in the daily chart endorse that view, as the Relative Strength Index (RSI) remains capped below the key 50 level, with the Moving Average Convergence Divergence (MACD) in negative territory.
Bears are likely to be tested at Tuesday's low, near $4,290. A confirmation below here exposes the August 7 and September 16 lows, around $4,230, which is also the neckline of a bearish Head & Shoulders (H&S) formation.
On the topside, immediate resistance is at the mentioned $4,400 area, which has capped bulls several times in recent days, closing the path towards the September 3 high at $4,510 and the key 200-day Simple Moving Average (SMA) at $4,541.
(The technical analysis of this story was written with the help of an AI tool. Know more.)
Author

Guillermo Alcala
FXStreet
Graduated in Communication Sciences at the Universidad del Pais Vasco and Universiteit van Amsterdam, Guillermo has been working as financial news editor and copywriter in diverse Forex-related firms, like FXStreet and Kantox.