|

USD/CHF Price Analysis: Fails at 0.9000, dips below key support levels amidst fading selling pressure

  • USD/CHF drops below key 0.90 level, extending losses as sellers eye a test of the 0.8900 mark.
  • Despite losses, fading selling pressure indicated by RSI and positive three-day RoC signals potential recovery.
  • If breached, initial resistance at 20-day EMA opens path to 50-day EMA at 0.9007 and beyond.

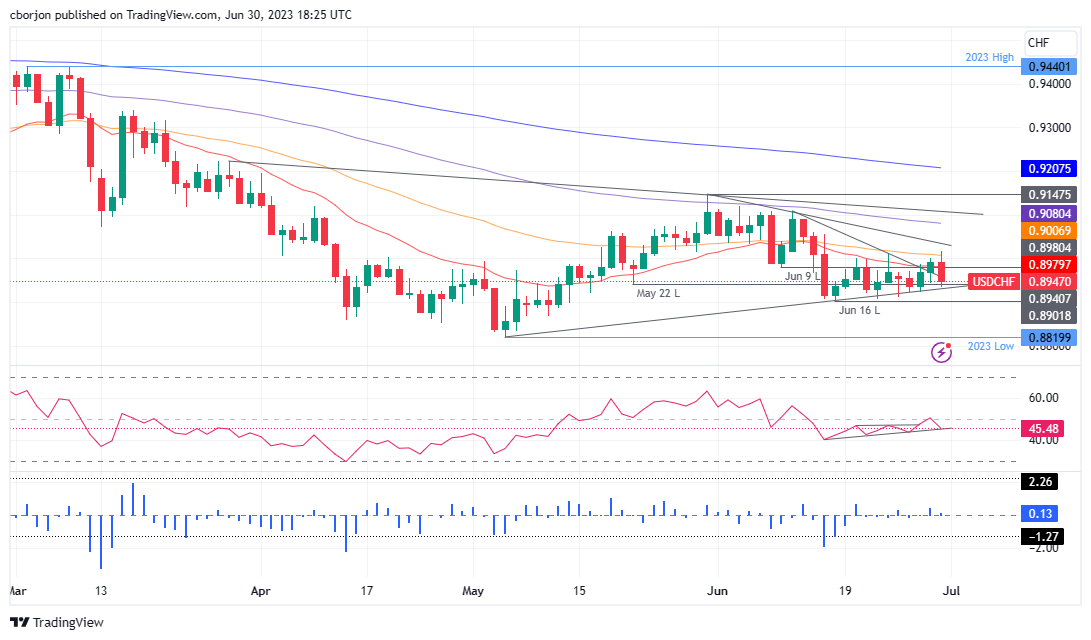
USD/CHF fails to decisively crack the 50-day Exponential Moving Average (EMA) at 0.9007, drops beneath the 0.90 figure, and extends its losses below technical support levels, as sellers see a test of the 0.8900 mark. At the time of writing, the USD/CHF trades at 0.8947, down 0.51%.

USD/CHF Price Analysis: Technical outlook

The USD/CHF is neutral to downward biased, as price action remains constrained within the 0.89/0.90 area for the last two trading weeks. The Relative Strength Index (RSI) indicator portrays sellers in charge, but it should be said the RSI has printed higher throughs, suggesting selling pressure is fading. In the meantime, the three-day Rate of Change (RoC) remains positive despite the USD/CHF is printing losses.

If USD/CHF continues to edge lower, the first support would be 0.8900. A breach of the latter will expose the year-to-date (YTD) low of 0.8819. Conversely, if buyers reclaim the 20-day EXMA at 0.8979, that will expose the 50-day EMA at 0.9007. Once cleared, the next resistance would be the 100-day EMA at 0.9080 before challenging the 0.9100 mark.

USD/CHF Price Analysis: Price Action – Daily chart

USD/CHF Daily chart

USD/CHF

Overview
Today last price0.8947
Today Daily Change-0.0047
Today Daily Change %-0.52
Today daily open0.8994
 
Trends
Daily SMA200.9001
Daily SMA500.898
Daily SMA1000.9088
Daily SMA2000.9309
 
Levels
Previous Daily High0.9002
Previous Daily Low0.8944
Previous Weekly High0.9013
Previous Weekly Low0.8907
Previous Monthly High0.9148
Previous Monthly Low0.882
Daily Fibonacci 38.2%0.898
Daily Fibonacci 61.8%0.8966
Daily Pivot Point S10.8957
Daily Pivot Point S20.8921
Daily Pivot Point S30.8899
Daily Pivot Point R10.9016
Daily Pivot Point R20.9038
Daily Pivot Point R30.9074
 

Author

Christian Borjon Valencia

Markets analyst, news editor, and trading instructor with over 14 years of experience across FX, commodities, US equity indices, and global macro markets.

More from Christian Borjon Valencia
Share:

Editor's Picks

EUR/USD eyes nine-day EMA barrier after rebounding from 1.1600

EUR/USD gains ground after registering modest losses in the previous session, trading around 1.1620 during the Asian hours on Friday. The technical analysis of the daily chart suggests an ongoing bearish bias as the pair remains within the descending channel pattern.

GBP/USD: Pound Sterling ticks up against US Dollar in countdown to US NFP

The Pound Sterling trades marginally higher to near 1.3365 against the US Dollar during the Asian trading session on Friday. The GBP/USD pair edges up as the US Dollar ticks down ahead of the United States Nonfarm Payrolls data for February, which will be published at 13:30 GMT.

Gold awaits US Nonfarm Payrolls for a clear directional impetus

Gold rebounds above $5,100 early Friday after testing the $5,050 level amid global sell-off. The US Dollar pulls back as profit-taking creeps in ahead of US labor data. For February. 21-day SMA holds amid bullish RSI; a daily closing above 61.8% Fibo is critical for Gold buyers.

Top Crypto Gainers: Lombard, Humanity Protocol, OKB rally on US Fed’s tokenized securities clarity, NYSE investment

Lombard, Humanity Protocol, and OKB rally over the last 24 hours, securing the top-gainer spots in the early Asian session. The US Federal Reserve issued clarity on tokenized securities, which expands its utility and reduces regulatory friction with US banks, driving the Real-World Assets tokenization crypto projects. 

The market compass is pointing at a barrel of Oil

The Asian open is arriving with equities leaning the wrong way, and the reason is not complicated. The market’s compass needle has snapped firmly toward crude. In this tape, oil is not just another input price; it is the gravitational center around which every asset class is orbiting.

Ripple tests recovery strength amid steady ETF inflows, growing retail interest

Ripple (XRP) continues to demonstrate notable resilience as the cryptocurrency market navigates the persistent war in the Middle East after the United States (US) and Israel attacked Iran on Saturday.