• The USD/CHF reclaims the 0.9700 figure, advancing towards the 0.9800 mark, up by 0.70%.
  • USD/CHF Price Analysis: A daily close above 0.9740 opens the way towards 0.9900; otherwise, a fall to 0,9600 is on the cards.

The USD/CHF climbs during the North American session, hitting a six-week high at around 0.9762, leaving below the 20-day EMA, widening the gap from the long-term daily moving averages (DMAs). At the time of writing, the USD/CHF exchanges hands at 0.9746, up 0.70%.

USD/CHF Price Analysis: Technical outlook

The USD/CHF weekly chart illustrates the pair extended its gains above the 20-EMA, lying at 0.9676, following Monday’s unsuccessful break. Additionally, the Relative Strength Index (RSI) crossed above the 7-week RSI’s SMA, aiming higher, showing buyers are gathering momentum. Therefore, the USD/CHF is resuming its upward bias in the near term.

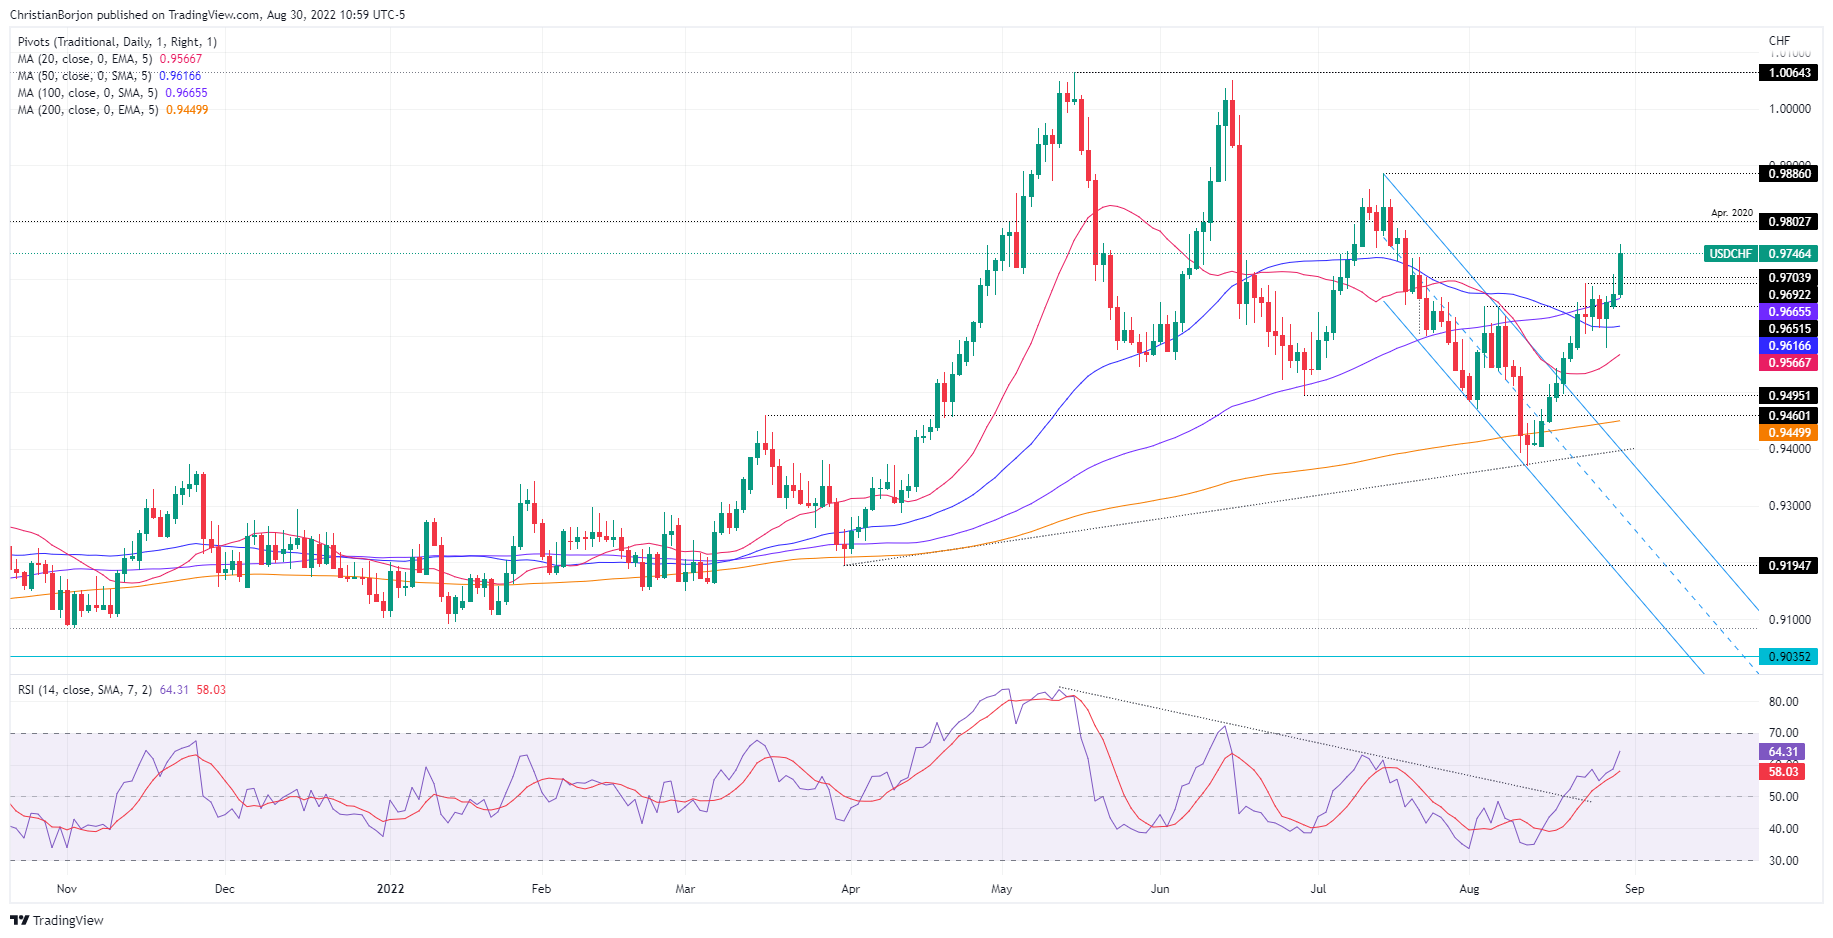
The USD/CHF daily chart illustrates the major bouncing off the 100-day EMA, after Monday’s failure to do, and extended its gains to hit a daily high at 0-9762 before retreating toward current price levels, just above the July 21 high at 0.9739. If the USD/CHF achieves a daily close below tie latter, a retracement towards the 0.9600 figure is on the cards. Otherwise, the USD/CHF could continue its way north, towards the 0.9886 mark, ahead of the 0.9900 psychological level.

Hence, the USD/CHF first resistance would be the 0.9800 figure, followed by the July 14 daily high at 0.9886, ahead of the psychologically 0.9900 mark. On the other hand, the USD/CHF first support would be the 0.9700 figure. Once cleared, the next demand area would be the 100-day EMA at 0.9665, followed by the 50-day EMA at 0.9616, and then the August 26 daily low at 0.9577.

USD/CHF Key Technical Levels

USD/CHF

Overview
Today last price 0.9746
Today Daily Change 0.0061
Today Daily Change % 0.63
Today daily open 0.9685
 
Trends
Daily SMA20 0.9564
Daily SMA50 0.962
Daily SMA100 0.9666
Daily SMA200 0.9452
 
Levels
Previous Daily High 0.9708
Previous Daily Low 0.9658
Previous Weekly High 0.9692
Previous Weekly Low 0.9574
Previous Monthly High 0.9886
Previous Monthly Low 0.9502
Daily Fibonacci 38.2% 0.9689
Daily Fibonacci 61.8% 0.9677
Daily Pivot Point S1 0.9659
Daily Pivot Point S2 0.9633
Daily Pivot Point S3 0.9609
Daily Pivot Point R1 0.9709
Daily Pivot Point R2 0.9733
Daily Pivot Point R3 0.9759


Share: Feed news

Information on these pages contains forward-looking statements that involve risks and uncertainties. Markets and instruments profiled on this page are for informational purposes only and should not in any way come across as a recommendation to buy or sell in these assets. You should do your own thorough research before making any investment decisions. FXStreet does not in any way guarantee that this information is free from mistakes, errors, or material misstatements. It also does not guarantee that this information is of a timely nature. Investing in Open Markets involves a great deal of risk, including the loss of all or a portion of your investment, as well as emotional distress. All risks, losses and costs associated with investing, including total loss of principal, are your responsibility. The views and opinions expressed in this article are those of the authors and do not necessarily reflect the official policy or position of FXStreet nor its advertisers. The author will not be held responsible for information that is found at the end of links posted on this page.

If not otherwise explicitly mentioned in the body of the article, at the time of writing, the author has no position in any stock mentioned in this article and no business relationship with any company mentioned. The author has not received compensation for writing this article, other than from FXStreet.

FXStreet and the author do not provide personalized recommendations. The author makes no representations as to the accuracy, completeness, or suitability of this information. FXStreet and the author will not be liable for any errors, omissions or any losses, injuries or damages arising from this information and its display or use. Errors and omissions excepted.

The author and FXStreet are not registered investment advisors and nothing in this article is intended to be investment advice.

Recommended content


Recommended content

Editors’ Picks

EUR/USD clings to daily gains above 1.0650

EUR/USD clings to daily gains above 1.0650

EUR/USD gained traction and turned positive on the day above 1.0650. The improvement seen in risk mood following the earlier flight to safety weighs on the US Dollar ahead of the weekend and helps the pair push higher.

EUR/USD News

GBP/USD recovers toward 1.2450 after UK Retail Sales data

GBP/USD recovers toward 1.2450 after UK Retail Sales data

GBP/USD reversed its direction and advanced to the 1.2450 area after touching a fresh multi-month low below 1.2400 in the Asian session. The positive shift seen in risk mood on easing fears over a deepening Iran-Israel conflict supports the pair.

GBP/USD News

Gold holds steady at around $2,380 following earlier spike

Gold holds steady at around $2,380 following earlier spike

Gold stabilized near $2,380 after spiking above $2,400 with the immediate reaction to reports of Israel striking Iran. Meanwhile, the pullback seen in the US Treasury bond yields helps XAU/USD hold its ground.

Gold News

Bitcoin Weekly Forecast: BTC post-halving rally could be partially priced in Premium

Bitcoin Weekly Forecast: BTC post-halving rally could be partially priced in

Bitcoin price shows no signs of directional bias while it holds above  $60,000. The fourth BTC halving is partially priced in, according to Deutsche Bank’s research. 

Read more

Week ahead – US GDP and BoJ decision on top of next week’s agenda

Week ahead – US GDP and BoJ decision on top of next week’s agenda

US GDP, core PCE and PMIs the next tests for the Dollar. Investors await BoJ for guidance about next rate hike. EU and UK PMIs, as well as Australian CPIs also on tap.

Read more

Forex MAJORS

Cryptocurrencies

Signatures