• USD/CHF holds to its gains above the 50 and 100-DMA.
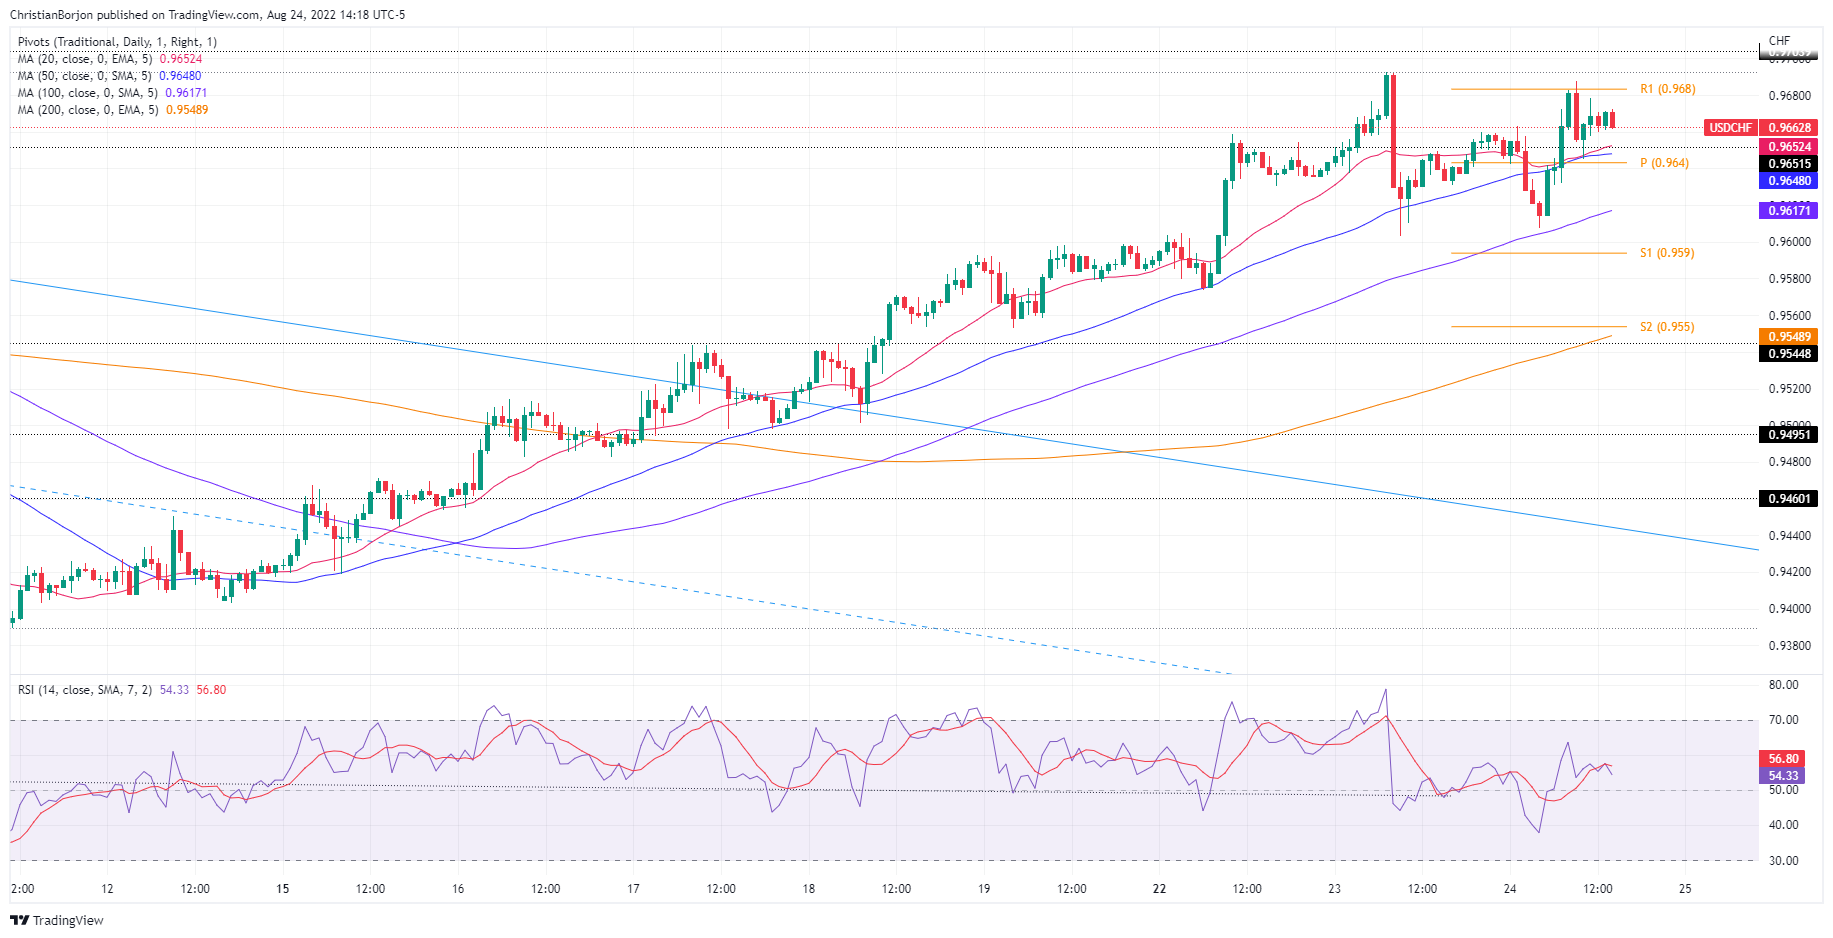
  • The USD/CHF daily chart illustrates the pair as neutral biased.
  • In the 4-hour chart, unsuccessfully tests of the 20-EMA on the downside keep the USD/CHF tilted upwards.

USD/CHF advances during the North American session, up by 0.31%, bolstered by a strong US dollar, despite a release of mixed US economic data ahead of the so-awaited Jerome Powell speech at Jackson Hole. At the time of writing, the USD/CHF is trading at 0.9662, above its 50 and 100-day EMAs.

USD/CHF Price Analysis: Technical outlook

The daily chart illustrates price action in the last couple of days as range-bound, about to form a “bearish-harami” candle pattern, which would pose downward pressure on the major. Nevertheless, the Relative Strength Index (RSI) at 58.65 exerts upward pressure on the pair, meaning that the best way to trade the USD/CHF from a daily chart perspective is to expect a break of the previous high/low and wait for a re-test of the breakout.

The 4-hour chart paints a different picture. The USD/CHF has been advancing steadily since August 11, until Tuesday, when the USD/CHF printed a negative day. Nevertheless, it’s worth noting that the day’s low pierced the 20-EMA of the 4-hour chart, stalling the major’s dive before consolidating for a re-test. Today, the USD/CHF re-tested the previously-mentioned moving average, and for the second consecutive time, USD/CHF buyers lifted prices to current price levels.

However, with the Relative Strength Index (RSI) at 61.73, aiming downwards could keep the USD/CHF risks skewed to the downside. But if the USD/CHF breaks above the August 23 high at 0.9692, that will expose the 0.9700 figure, followed by the R2 daily pivot at 0.9730.

USD/CHF Key Technical Levels

USD/CHF

Overview
Today last price 0.9662
Today Daily Change 0.0024
Today Daily Change % 0.25
Today daily open 0.9638
 
Trends
Daily SMA20 0.9539
Daily SMA50 0.9627
Daily SMA100 0.9653
Daily SMA200 0.9445
 
Levels
Previous Daily High 0.9692
Previous Daily Low 0.9603
Previous Weekly High 0.9598
Previous Weekly Low 0.9409
Previous Monthly High 0.9886
Previous Monthly Low 0.9502
Daily Fibonacci 38.2% 0.9637
Daily Fibonacci 61.8% 0.9658
Daily Pivot Point S1 0.9597
Daily Pivot Point S2 0.9555
Daily Pivot Point S3 0.9507
Daily Pivot Point R1 0.9686
Daily Pivot Point R2 0.9734
Daily Pivot Point R3 0.9775


Share: Feed news

Information on these pages contains forward-looking statements that involve risks and uncertainties. Markets and instruments profiled on this page are for informational purposes only and should not in any way come across as a recommendation to buy or sell in these assets. You should do your own thorough research before making any investment decisions. FXStreet does not in any way guarantee that this information is free from mistakes, errors, or material misstatements. It also does not guarantee that this information is of a timely nature. Investing in Open Markets involves a great deal of risk, including the loss of all or a portion of your investment, as well as emotional distress. All risks, losses and costs associated with investing, including total loss of principal, are your responsibility. The views and opinions expressed in this article are those of the authors and do not necessarily reflect the official policy or position of FXStreet nor its advertisers. The author will not be held responsible for information that is found at the end of links posted on this page.

If not otherwise explicitly mentioned in the body of the article, at the time of writing, the author has no position in any stock mentioned in this article and no business relationship with any company mentioned. The author has not received compensation for writing this article, other than from FXStreet.

FXStreet and the author do not provide personalized recommendations. The author makes no representations as to the accuracy, completeness, or suitability of this information. FXStreet and the author will not be liable for any errors, omissions or any losses, injuries or damages arising from this information and its display or use. Errors and omissions excepted.

The author and FXStreet are not registered investment advisors and nothing in this article is intended to be investment advice.

Recommended content


Recommended content

Editors’ Picks

EUR/USD holds above 1.0700 ahead of key US data

EUR/USD holds above 1.0700 ahead of key US data

EUR/USD trades in a tight range above 1.0700 in the early European session on Friday. The US Dollar struggles to gather strength ahead of key PCE Price Index data, the Fed's preferred gauge of inflation, and helps the pair hold its ground. 

EUR/USD News

USD/JPY stays above 156.00 after BoJ Governor Ueda's comments

USD/JPY stays above 156.00 after BoJ Governor Ueda's comments

USD/JPY holds above 156.00 after surging above this level with the initial reaction to the Bank of Japan's decision to leave the policy settings unchanged. BoJ Governor said weak Yen was not impacting prices but added that they will watch FX developments closely.

USD/JPY News

Gold price oscillates in a range as the focus remains glued to the US PCE Price Index

Gold price oscillates in a range as the focus remains glued to the US PCE Price Index

Gold price struggles to attract any meaningful buyers amid the emergence of fresh USD buying. Bets that the Fed will keep rates higher for longer amid sticky inflation help revive the USD demand.

Gold News

Sei Price Prediction: SEI is in the zone of interest after a 10% leap

Sei Price Prediction: SEI is in the zone of interest after a 10% leap

Sei price has been in recovery mode for almost ten days now, following a fall of almost 65% beginning in mid-March. While the SEI bulls continue to show strength, the uptrend could prove premature as massive bearish sentiment hovers above the altcoin’s price.

Read more

US core PCE inflation set to signal firm price pressures as markets delay Federal Reserve rate cut bets

US core PCE inflation set to signal firm price pressures as markets delay Federal Reserve rate cut bets

The core PCE Price Index, which excludes volatile food and energy prices, is seen as the more influential measure of inflation in terms of Fed positioning. The index is forecast to rise 0.3% on a monthly basis in March, matching February’s increase. 

Read more

Forex MAJORS

Cryptocurrencies

Signatures