|

USD/CHF Price Analysis: Bearish continuation hinges on 0.8566 eight-year low

  • USD/CHF drops 3%, RSI suggests potential recovery, past 0.8700, as a bullish-engulfing pattern could form.
  • USD/CHF’s bearish extension hinges on breaking 0.8566 support.

USDH/CHF regains some composture after plummeting more than 3% in the week, breaking technical support levels due to overall US Dollar (USD) weakness across the Forex (FX) board. Slow inflation in the United States (US) triggered market players to pare bets the US Federal Reserve (Fed) will tighten monetary conditions past the Fed July meeting. Hence, the greenback weakened and, against the Swiss Franc (CHF), lost more than 250 pips. The USD/CHF is trading at 0.8622 after reaching a new eight-year low of 0.8566.

USD/CHF Price Analysis: Technical outlook

From a technical standpoint, the USD/CHF is suggested to continue downwards. Still, the Relative Strength Index (RSI) indicator, hitting an extreme 21.47 reading, jumped and is about to cross above the 30 line. That, along with the three-day Rate of Change (RoC) portraying sellers are beginning to lose momentum, could pave the way for the USD/CHF to recover some ground.

If USD/CHF buyers reclaim the 0.8700 figure, that could form a bullish-engulfing candlestick pattern, opening the door for an upward correction. Still, the USD/CHF will remain downward biased unless traders push prices past the 200-day EMA at 0.9179.

A bearish continuation will resume once USD/CHF sellers drag prices below 0.8566, exposing the 0.8500 mark, followed by the 0.8400 figure, ahead of diving towards the 2015 yearly low of 0.8300.

USD/CHF Price Action – Daily chart
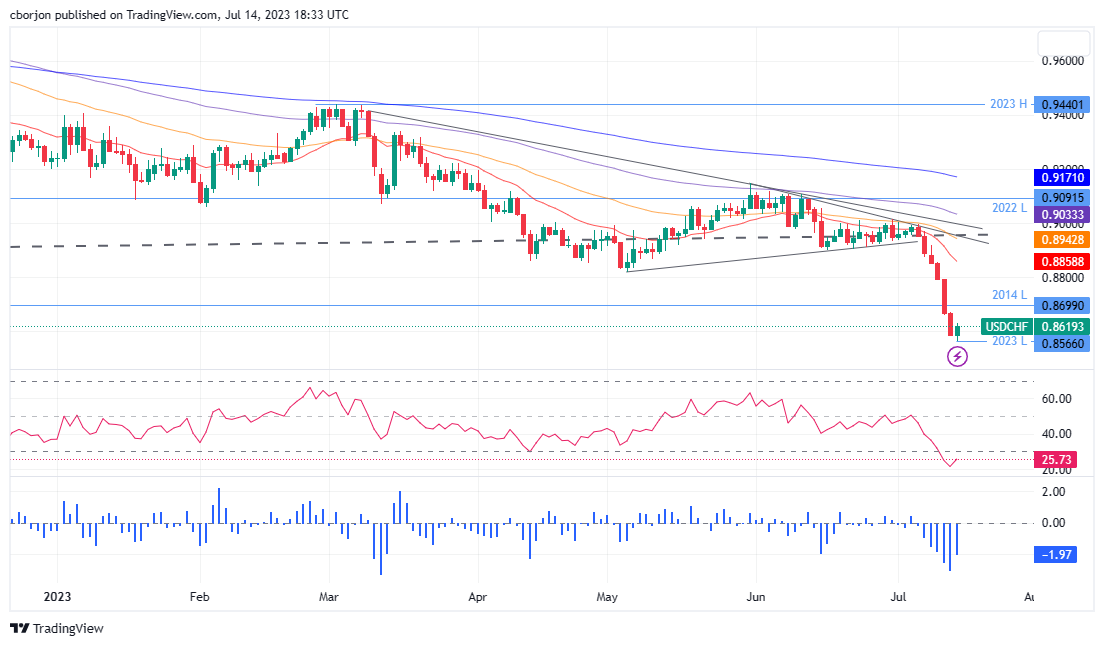
USD/CHF Daily chart

USD/CHF

Overview
Today last price0.862
Today Daily Change0.0032
Today Daily Change %0.37
Today daily open0.8588
 
Trends
Daily SMA200.8911
Daily SMA500.8971
Daily SMA1000.9048
Daily SMA2000.9259
 
Levels
Previous Daily High0.8676
Previous Daily Low0.8582
Previous Weekly High0.9005
Previous Weekly Low0.8876
Previous Monthly High0.912
Previous Monthly Low0.8902
Daily Fibonacci 38.2%0.8618
Daily Fibonacci 61.8%0.864
Daily Pivot Point S10.8555
Daily Pivot Point S20.8522
Daily Pivot Point S30.8462
Daily Pivot Point R10.8648
Daily Pivot Point R20.8708
Daily Pivot Point R30.8741

Author

Christian Borjon Valencia

Markets analyst, news editor, and trading instructor with over 14 years of experience across FX, commodities, US equity indices, and global macro markets.


More from Christian Borjon Valencia
Share:

Editor's Picks

GBP/USD revisits 1.3530; Dollar pushes harder

GBP/USD adds to the weekly correction and recedes toward the 1.3530 zone on Friday. Indeed, Cable faces increasing selling pressure on the back of extra gains in the Greenback, particularly fuelled by Chair Warsh’s speech at the Jackson Hole Symposium and the US NFP Annual Revision (-79K).

EUR/USD breaches below 1.1600, multi-day lows

EUR/USD now accelerates its decline and retreats to seven-day troughs in the sub-1.1600 region at the end of the week. The pair’s pullback comes on the back of the strong rebound in the US Dollar after Chair Warsh delivered a hawkish message in Jackson Hole, while the US NFP Annual Revision came in at -79K.

Gold challenges its 200-day SMA near $4,530

Gold’s decline gathers fresh steam, hitting weekly lows while disputing its critical 200-day SMA near $4,530 per troy ounce. The yellow metal’s increasing weakness comes in response to the generalised upbeat tone in the US Dollar and the widespread rebound in US Treasury yields, as investors continue to reprice a Fed rate hike in September.

Week ahead: RBNZ and BoC decide on rates ahead of all-important US NFP
The US dollar staged a modest recovery this week, perhaps as traders decided to cover some of their short positions amid slightly stickier or in-line US PCE inflation numbers for July, confounding expectations of softer prints amid the softness revealed in the CPI data for the month.
CFTC Report: CAD short covering leads; Gold buying surges
The week in one sentence: speculative positioning shifted more constructively in the week to August 25. CAD short covering led the move, followed by a broad reduction in EUR shorts and renewed Gold buying. GBP and VIX positioning also improved, while JPY positioning deteriorated and WTI flows diverged from weaker prices.
Diesel’s record $100 warning: The oil shock hiding in plain sight

The Oil market may look calmer than it did a few months ago, but diesel is sending a very different message. The US diesel crack spread, the premium of ultra-low sulphur diesel futures over WTI, recently surged above $100 per barrel for the first time, reaching an intraday record of just over $102.00.