|

USD/CHF kicking back into the 200-day SMA, cracks 0.9000 on solid US data beats

  • The USD/CHF is toying with 0.9000 as the Greenback gets bid into a third straight day of gains.
  • Little of note for the Franc on the economic calendar until next Tuesday's Swiss Retail Sales.
  • US Durable Goods, GDP figures soundly trounce market expectations, though labor data sees more unemployed.

The USD/CHF is trading directly into the 0.9000 major handle as US data beats drive the US Dollar (USD) higher against the Swiss Franc (CHF) for Thursday.

US Gross Domestic Product (GDP) and Durable Goods Orders both firmly beat the street, vaulting over forecasts and sparking a bid in the Greenback, despite a soft miss for US labor figures that saw an uptick in Continuing & Initial Jobless Claims.

Next Tuesday will see Swiss Retail Sales figures. In the meantime, there's little Swiss economic calendar data for CHF traders to chew on following Wednesday's miss in the ZEW business conditions expectations survey, which slipped from -27.6 to -37.8.

US GDP expands at an annual rate of 4.9% in Q3 vs. 4.2% expected

US GDP printed at a stellar 4.9% for the annualized 3rd quarter, handily beating market forecasts of 4.2% and vaulting over the previous quarter's 2.1% printing.

US Durable Goods Orders for September likewise came in well above the waterline, growing 4.7% for the month compared to August's downward-revised -0.1% (originally printed at 0.2%).

US Initial Jobless Claims bucked the trend to come in below expectations, showing an additional 210K new jobless benefits seekers for the week into October 20th, compared to the previous week's 200K (revised upwards from 198K).

USD/CHF Technical Outlook

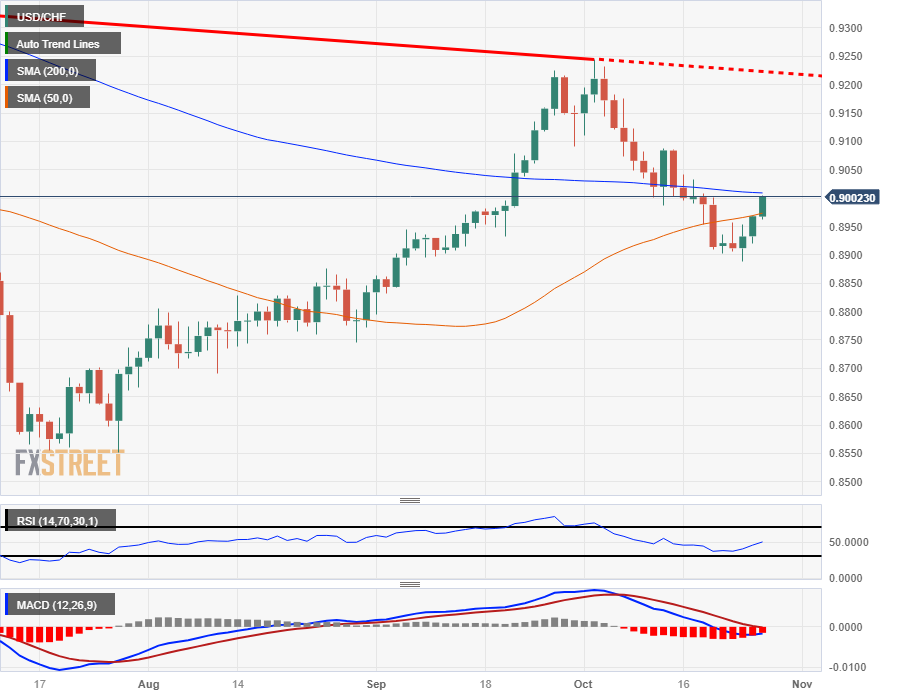
The US Dollar is testing into the long side of 0.9000 against the Franc after slipping from the price level last week, and is trading back into the 200-day Simple Moving Average (SMA).

The pair is catching some technical support from the 50-day SMA currently lifting into 0.8974, trapping bids in the midrange and squeezing the USD/CHF higher.

Last week's swing low into the 0.8900 level etches in near-term support, with the technical ceiling resting at early October's swing high bids near0.9250.

USD/CHF Daily Chart

USD/CHF Technical Levels

USD/CHF

Overview
Today last price0.9002
Today Daily Change0.0034
Today Daily Change %0.38
Today daily open0.8968
 
Trends
Daily SMA200.9048
Daily SMA500.8969
Daily SMA1000.8897
Daily SMA2000.901
 
Levels
Previous Daily High0.8969
Previous Daily Low0.8921
Previous Weekly High0.9042
Previous Weekly Low0.8902
Previous Monthly High0.9225
Previous Monthly Low0.8795
Daily Fibonacci 38.2%0.8951
Daily Fibonacci 61.8%0.8939
Daily Pivot Point S10.8936
Daily Pivot Point S20.8904
Daily Pivot Point S30.8888
Daily Pivot Point R10.8985
Daily Pivot Point R20.9001
Daily Pivot Point R30.9033

Author

Joshua Gibson

Joshua joins the FXStreet team as an Economics and Finance double major from Vancouver Island University with twelve years' experience as an independent trader focusing on technical analysis.

More from Joshua Gibson
Share:

Editor's Picks

AUD/USD bounces off weekly low on Israel-Lebanon ceasefire

AUD/USD recovers slightly from the weekly low during the Asian session on Thursday as a new Israel-Lebanon ceasefire keeps a lid on the safe-haven US Dollar. Meanwhile, the US and Iran remain at odds over key issues, which, along with hawkish Fed expectations, act as a tailwind for the buck. Furthermore, diminishing odds of an RBA rate hike in June cap the currency pair as traders keenly await the US NFP report on Friday.

USD/JPY remains close to 160.00 intervention threshold on Mideast tensions

USD/JPY struggles to find acceptance above 160.00 and retreats from a one-month high during the Asian session on Thursday amid fears that authorities will step in again to prop up the Japanese Yen. Furthermore, a new Israel-Lebanon ceasefire caps the US Dollar and supports the currency pair. However, renewed US-Iran tensions favor the USD bulls amid Fed rate hike bets and also hold back the JPY bulls from placing aggressive bets amid economic risks stemming from the Middle East conflict, suggesting that dips are likely to be bought into.

Gold bounces off one-week low; upside seems capped on Iran uncertainty

Gold recovers from a one-week low touched during the Asian session on Thursday, as news of an Israel-Lebanon ceasefire acts as a headwind for the safe-haven US Dollar. However, renewed hostilities in the Gulf, along with stalled US-Iran peace talks, keep geopolitical risks in play and should support the USD. Moreover, US-Iran tensions remain supportive of higher Crude Oil prices, fueling inflationary concerns and bolstering bets for higher interest rates for longer. This should cap the non-yielding bullion and warrants caution for bulls.


Bitcoin drops below $65K amid reinforced bear market signals

Bitcoin dipped further below $65,000 on Wednesday, with onchain data from Glassnode signaling a market firmly in a bear phase. The decline has pushed prices back into a key valuation range between the Realized Price and the True Market Mean. Glassnode noted that a key shift in market structure has also emerged.

The upside-down math of debt
In 2010, Professors Carmen Reinhart and Kenneth Rogoff published a paper, Growth in a Time of Debt, which instantly went viral. The main thesis of the paper was that once a government's debt-to-GDP ratio crosses above 90%, a financial crisis and default are around the corner.
Recession on paper: What really moves the Canadian Loonie now?

Statistics Canada handed the headline writers a gift and the analysts a headache. Real GDP shrank 0.1% on an annualized basis in the first quarter, and with the fourth quarter of 2025 revised down to a 1.0% contraction, that is two negative quarters in a row, the textbook definition of a technical recession and Canada's first since the pandemic.