USD/CAD Technical Analysis: Greenback sidelined below 1.3300 figure

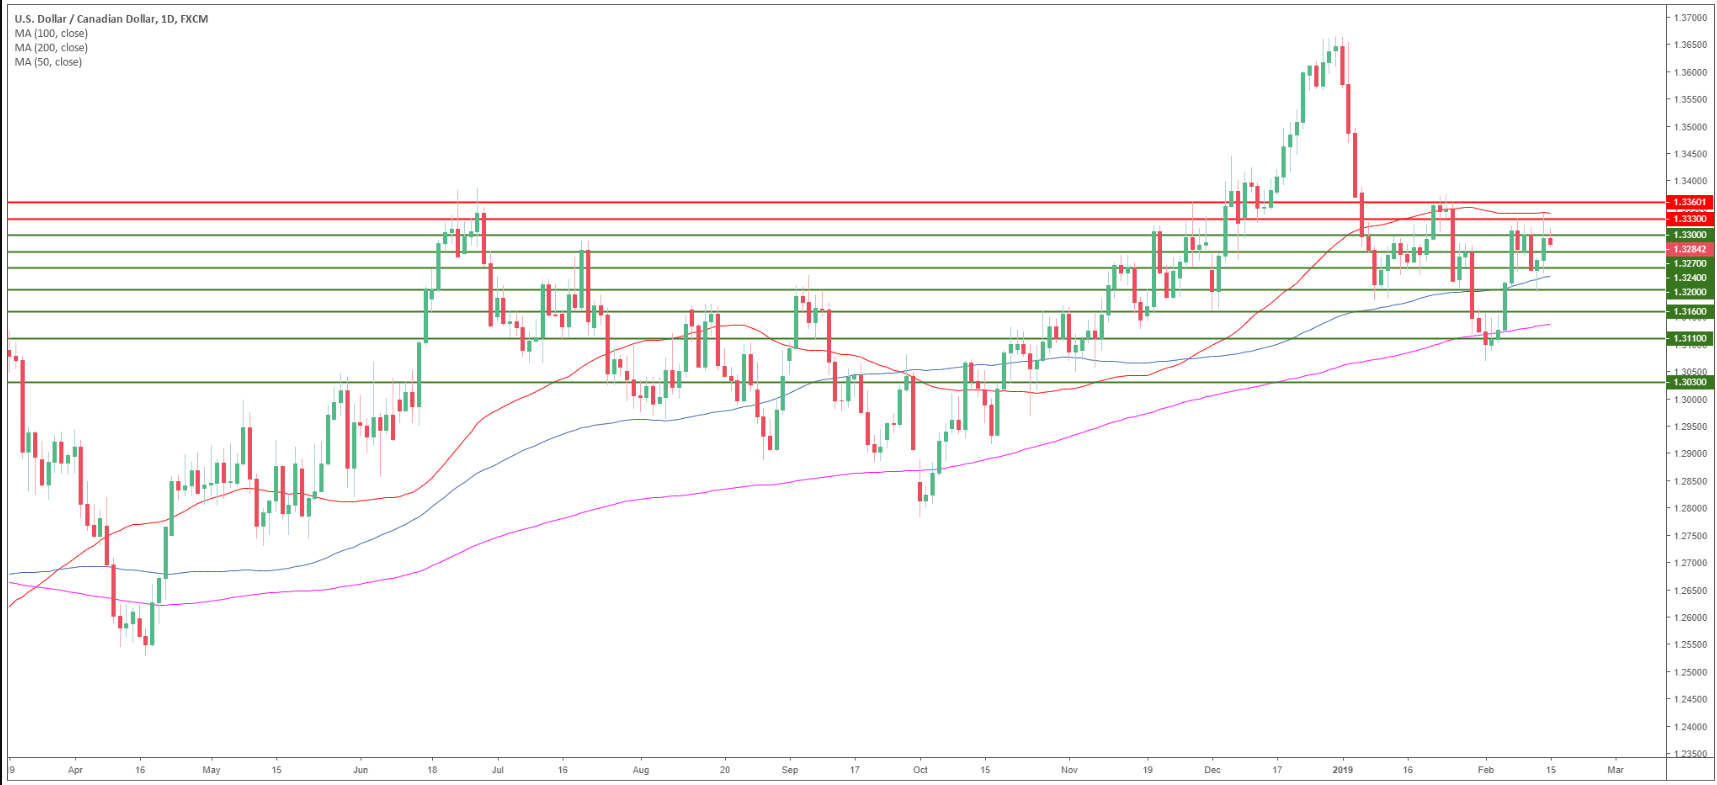
USD/CAD daily chart
- On the daily chart, USD/CAD is trading between the 50 and the 100-day simple moving averages (SMAs) suggesting a sideways market.
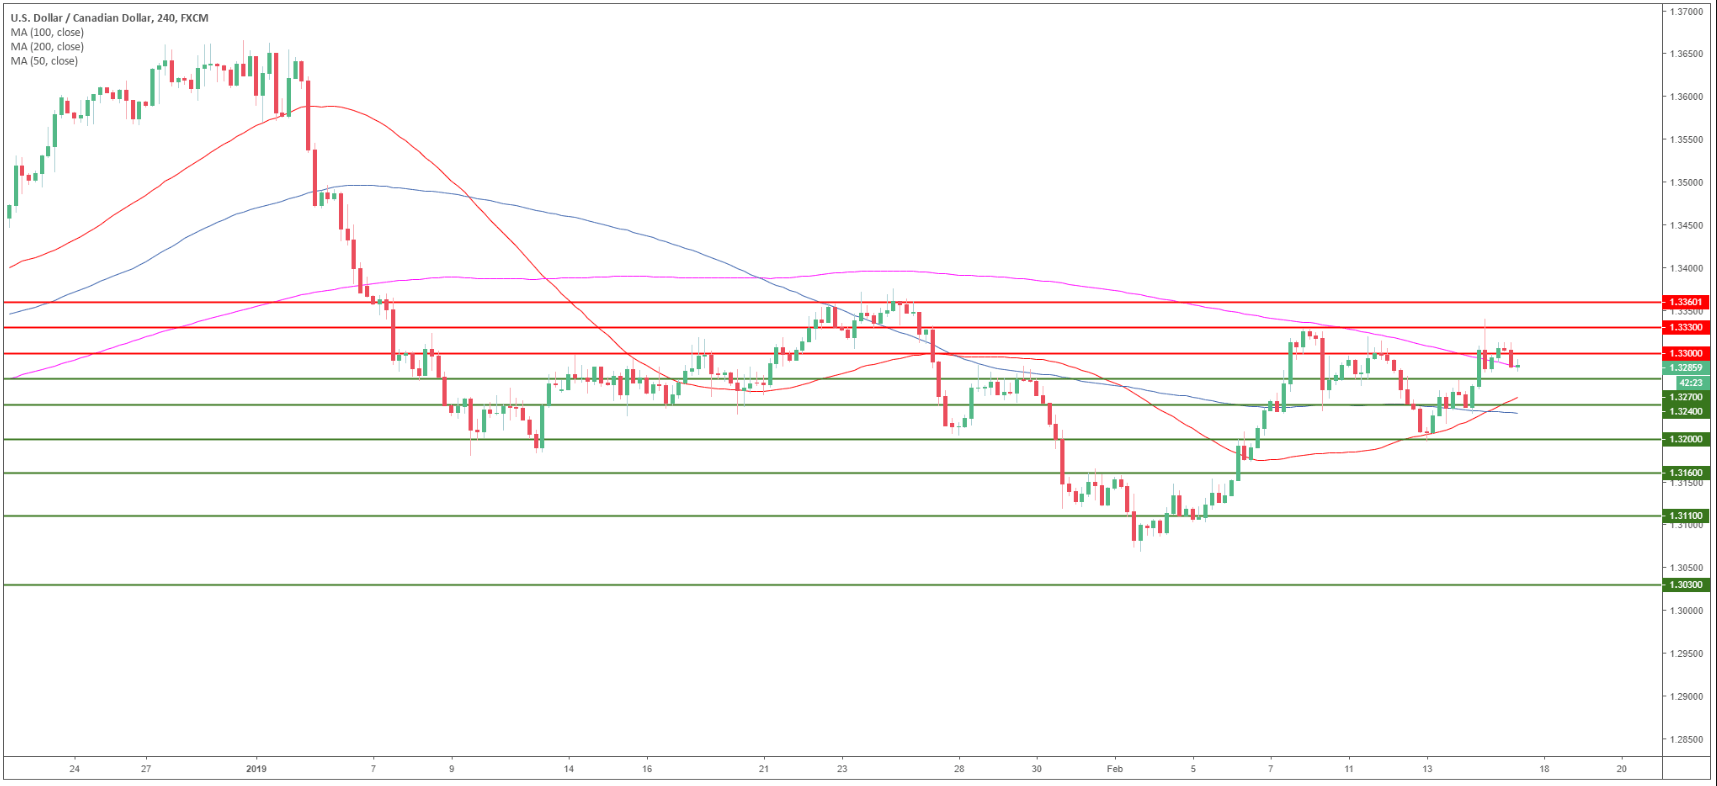
USD/CAD 4-hour chart
- USD/CAD is trading above its main SMA suggesting a bullish bias in the medium-term.
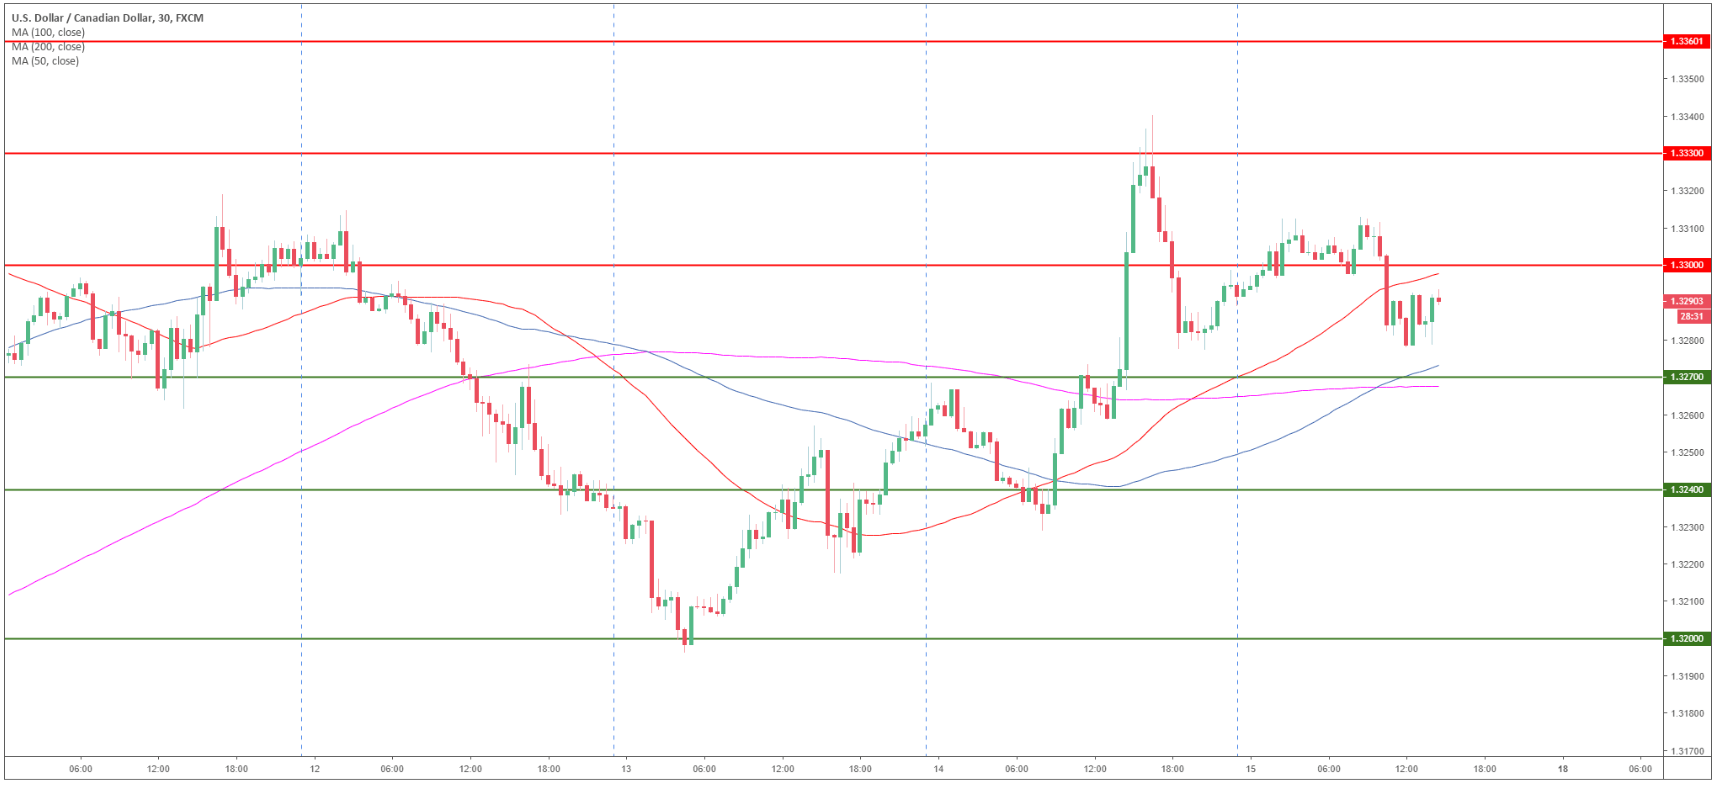
USD/CAD 30-minute chart
- USD/CAD is trading between the 50 and 200 SMAs suggesting a sideways market in the short-term.
- Bears will likely try to reach 1.3270 to the downside.
- Resistance is seen at 1.3300 and 1.3330 level.
Additional key levels
USD/CAD
Overview:
Today Last Price: 1.3292
Today Daily change %: 0.01%
Today Daily Open: 1.3291
Trends:
Daily SMA20: 1.3243
Daily SMA50: 1.3364
Daily SMA100: 1.3242
Daily SMA200: 1.3146
Levels:
Previous Daily High: 1.3341
Previous Daily Low: 1.3229
Previous Weekly High: 1.333
Previous Weekly Low: 1.3084
Previous Monthly High: 1.3664
Previous Monthly Low: 1.3118
Daily Fibonacci 38.2%: 1.3298
Daily Fibonacci 61.8%: 1.3272
Daily Pivot Point S1: 1.3233
Daily Pivot Point S2: 1.3175
Daily Pivot Point S3: 1.3121
Daily Pivot Point R1: 1.3345
Daily Pivot Point R2: 1.3399
Daily Pivot Point R3: 1.3456
Author

Flavio Tosti
Independent Analyst


