|

USD/CAD technical analysis: Greenback advancing to daily highs, testing 1.3158 resistance

  • USD/CAD is trading at daily highs challenging 1.3158 resistance.
  • The levels to beat for buyers are at 1.3158 and 1.3180.
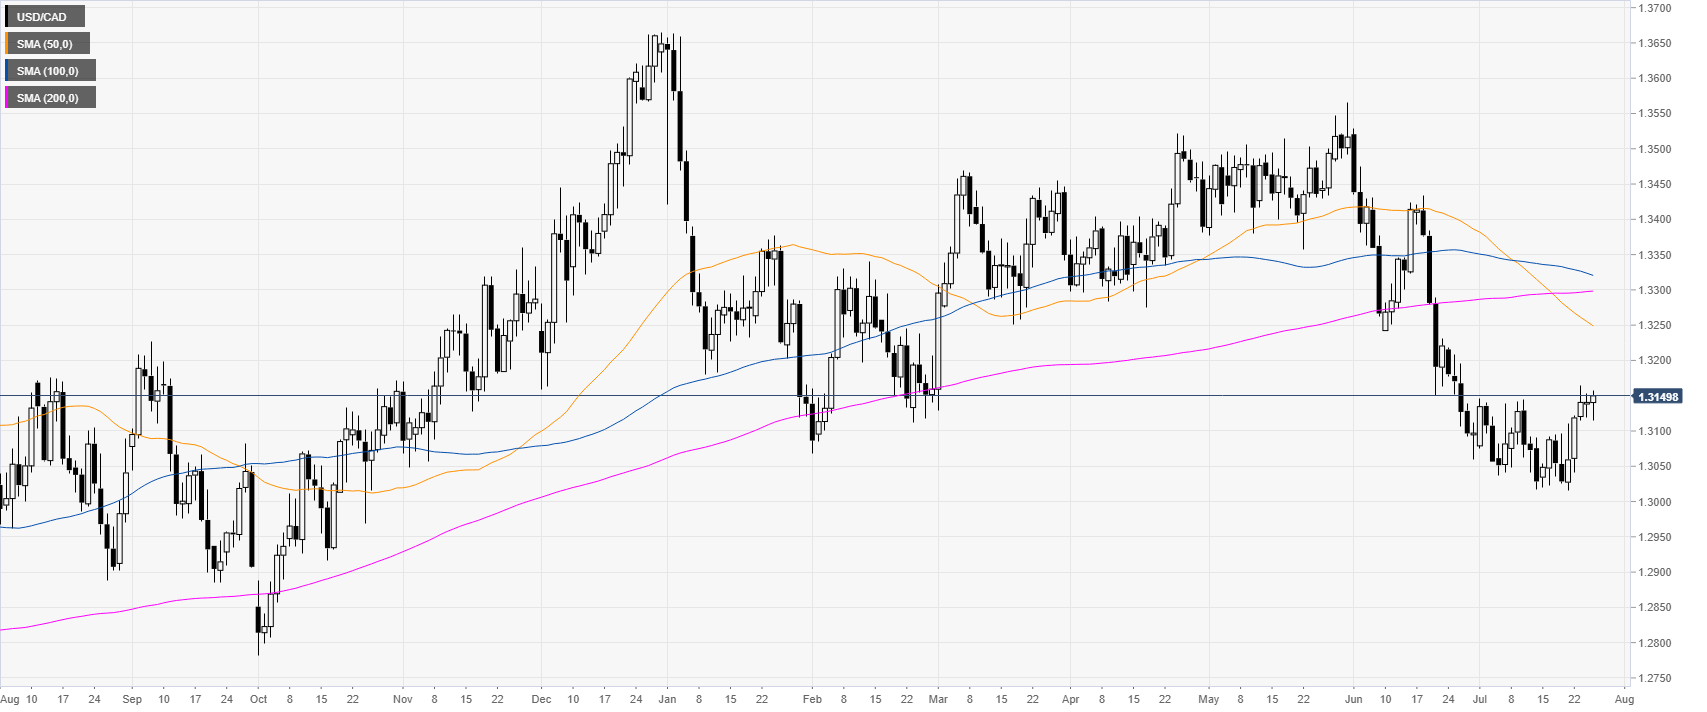
 

USD/CAD daily chart

 
USD/CAD is grinding up above the 1.3100 figure while trading below the main daily simple moving averages (DSMAs). 


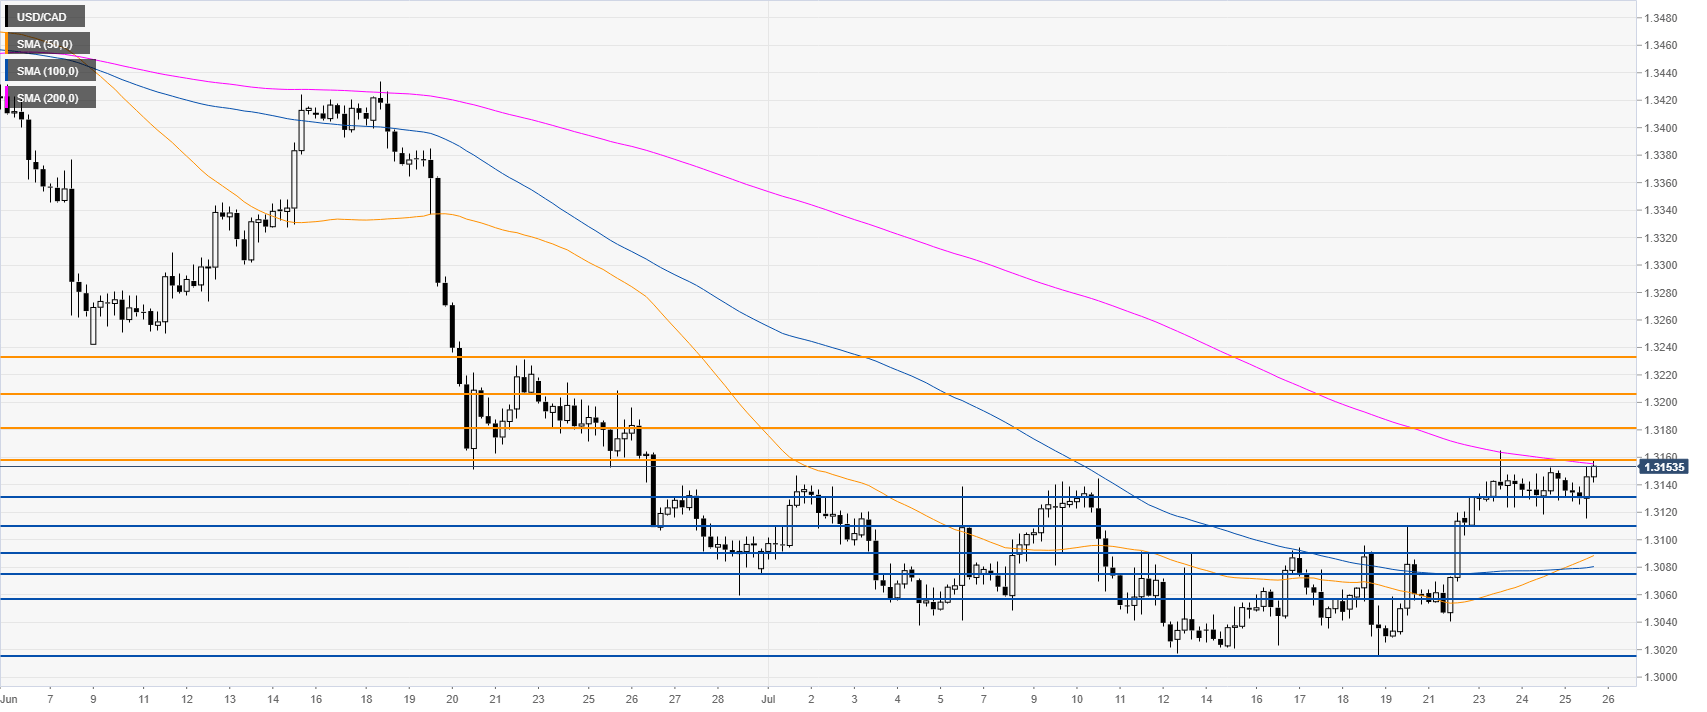
USD/CAD 4-hour chart


USD/CAD is challenging the 1.3158 resistance and the 200 SMA. A break above the resistance level can lead to 1.3180, 1.3205 and 1.3232 resistances on the way up, according to the Technical Confluences Indicator.


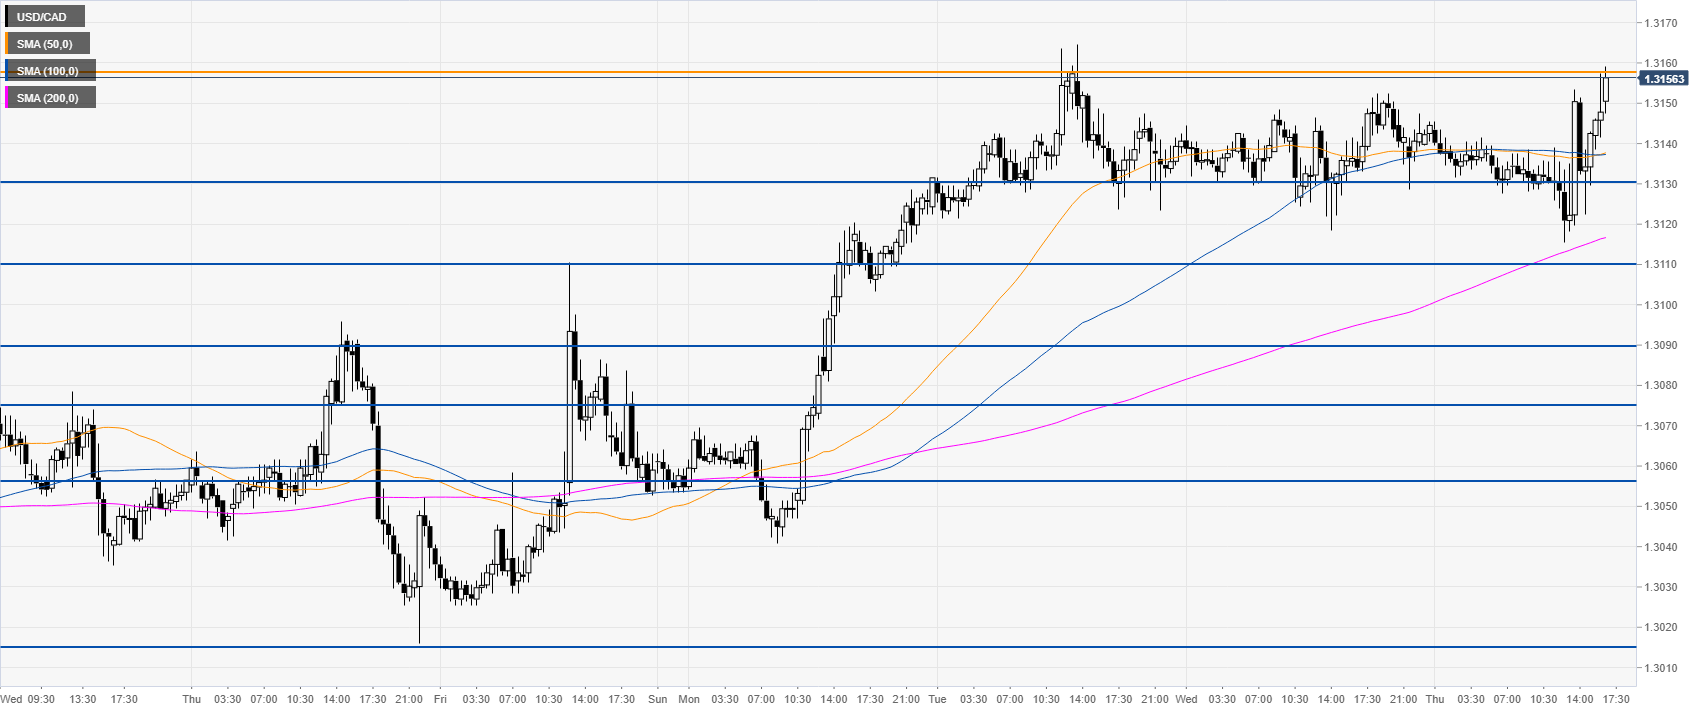
USD/CAD 30-minute chart


USD/CAD is trading above the main SMAs suggesting bullish momentum in the near term. Immediate support can be seen at 1.3130 and 1.3110, according to the Technical Confluences Indicator.
 

Additional key levels

USD/CAD

Overview
Today last price1.3156
Today Daily Change0.0016
Today Daily Change %0.12
Today daily open1.314
 
Trends
Daily SMA201.3085
Daily SMA501.3255
Daily SMA1001.3324
Daily SMA2001.3303
Levels
Previous Daily High1.3152
Previous Daily Low1.3118
Previous Weekly High1.311
Previous Weekly Low1.3016
Previous Monthly High1.3529
Previous Monthly Low1.306
Daily Fibonacci 38.2%1.314
Daily Fibonacci 61.8%1.3131
Daily Pivot Point S11.3122
Daily Pivot Point S21.3103
Daily Pivot Point S31.3088
Daily Pivot Point R11.3156
Daily Pivot Point R21.3171
Daily Pivot Point R31.319

Author

Flavio Tosti

Flavio Tosti

Independent Analyst


More from Flavio Tosti
Share:

Editor's Picks

EUR/USD treads water above 1.1850 amid thin trading

EUR/USD stays defensive but holds 1.1850 amid quiet markets in the European hours on Monday.  The US Dollar is struggling for direction due to thin liquidity conditions as US markets are closed in observance of Presidents' Day. 

GBP/USD flat lines as traders await key UK and US macro data

GBP/USD kicks off a new week on a subdued note and oscillates in a narrow range near 1.365 in Monday's European trading. The mixed fundamental backdrop warrants some caution for aggressive traders as the market focus now shifts to this week's important releases from the UK and the US.

Gold sticks to intraday losses; lacks follow-through

Gold remains depressed through the early European session on Monday, though it has managed to rebound from the daily trough and currently trades around the $5,000 psychological mark. Moreover, a combination of supporting factors warrants some caution for aggressive bearish traders, and before positioning for deeper losses.

Bitcoin, Ethereum and Ripple consolidate within key ranges as selling pressure eases

Bitcoin and Ethereum prices have been trading sideways within key ranges following the massive correction. Meanwhile, XRP recovers slightly, breaking above the key resistance zone. The top three cryptocurrencies hint at a potential short-term recovery, with momentum indicators showing fading bearish signs.

Global inflation watch: Signs of cooling services inflation

Realized inflation landed close to expectations in January, as negative base effects weighed on the annual rates. Remaining sticky inflation is largely explained by services, while tariff-driven goods inflation remains limited even in the US.

Ripple Price Forecast: XRP potential bottom could be in sight

Ripple edges up above the intraday low of $1.35 at the time of writing on Friday amid mixed price actions across the crypto market. The remittance token failed to hold support at $1.40 the previous day, reflecting risk-off sentiment amid a decline in retail and institutional sentiment.