USD/CAD Technical Analysis: 1.3250 resistance is a brick wall - Good luck for bulls !

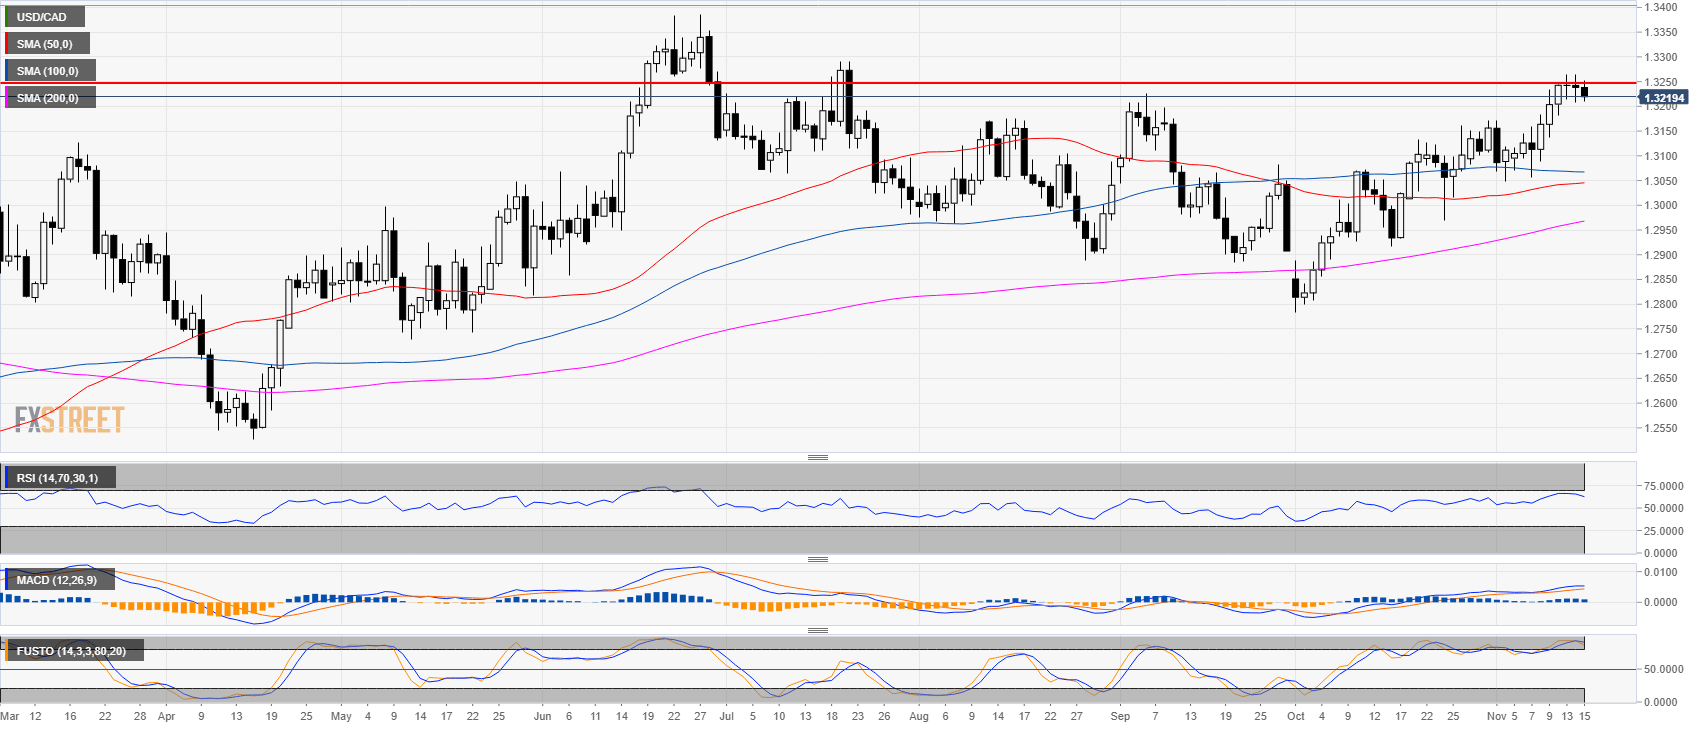
USD/CAD daily chart
- USD/CAD is finding resistance at the 1.3250 resistance for the fourth day in a row.
- The Stochastic indicator has been trading in and out of the overbought zone for about a month.
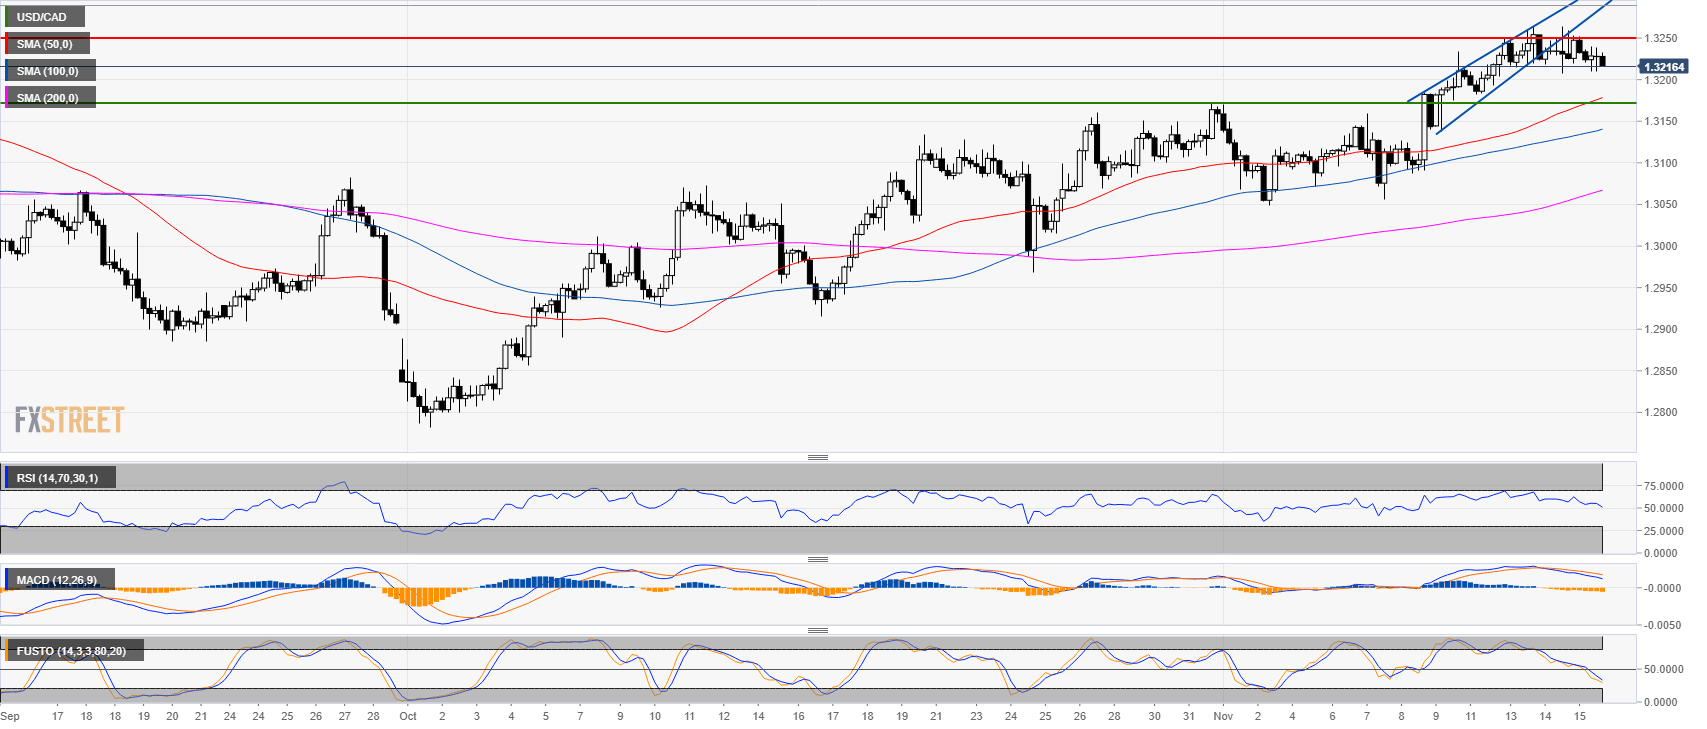
USD/CAD 4-hour chart
- The rising wedge is preventing the bulls to advance above 1.3250.
- Technical indicators are bearish, only the RSI is still above its 50 line.
- The 1.3170 level is the target for bears.
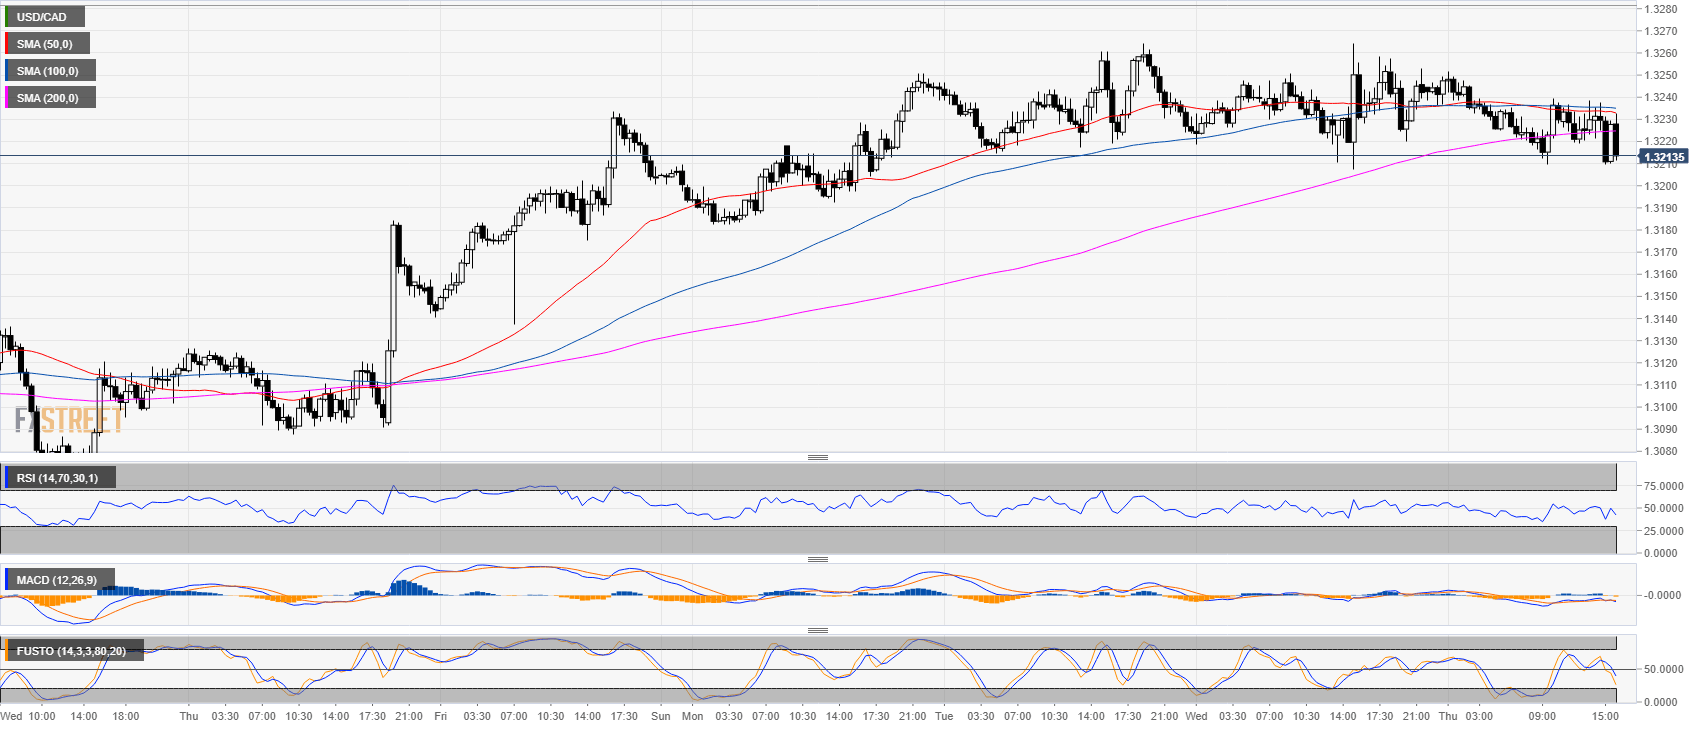
USD/CAD 30-minute chart
- USD/CAD is trading below its main SMAs.
- Technical indicators are all in bearish territories.
- More down likely.
Additional key levels at a glance:
USD/CAD
Overview:
Last Price: 1.322
Daily change: -18 pips
Daily change: -0.136%
Daily Open: 1.3238
Trends:
Daily SMA20: 1.3132
Daily SMA50: 1.3045
Daily SMA100: 1.307
Daily SMA200: 1.296
Levels:
Daily High: 1.3264
Daily Low: 1.3208
Weekly High: 1.3233
Weekly Low: 1.3056
Monthly High: 1.3172
Monthly Low: 1.2783
Daily Fibonacci 38.2%: 1.3229
Daily Fibonacci 61.8%: 1.3243
Daily Pivot Point S1: 1.3209
Daily Pivot Point S2: 1.318
Daily Pivot Point S3: 1.3152
Daily Pivot Point R1: 1.3266
Daily Pivot Point R2: 1.3294
Daily Pivot Point R3: 1.3323
Author

Flavio Tosti
Independent Analyst


