USD/CAD Price Forecast: Strengthens after Falling wedge breakout
- USD/CAD clings to gains near 1.3920 as the US Dollar performs strongly.
- The Fed has indicated that there is no rush for interest rate cuts.
- BoC warned that Trump’s tariffs have posed financial stability risks.

The USD/CAD pair holds onto gains made on Thursday around 1.3920 during European trading hours on Friday. The Loonie pair performs strongly as the US Dollar (USD) strengthens on multiple tailwinds.
At the time of writing, the US Dollar Index (DXY), which tracks the Greenback’s value against six major currencies, retreats from almost a month high of 100.85 to near 100.40, but is up more than 1% in the last two trading days.
The US Dollar strengthened as the Federal Reserve (Fed) signaled in the monetary policy announcement on Wednesday that there is no rush for interest rate cuts, given elevated uncertainty due to new economic policies announced by the United States (US) President Donald Trump. Another reason behind firmness in the US Dollar is the announcement of the US-United Kingdom (UK) trade deal.
Meanwhile, investors await trade discussions between the US and China, which are confirmed in Switzerland on Saturday.
In the Canadian region, the annual Financial Stability Report from the Bank of Canada (BoC) showed on Thursday that the Trump-led trade war poses “risks to financial stability”. The report also showed concerns over “household and business credit defaults”.
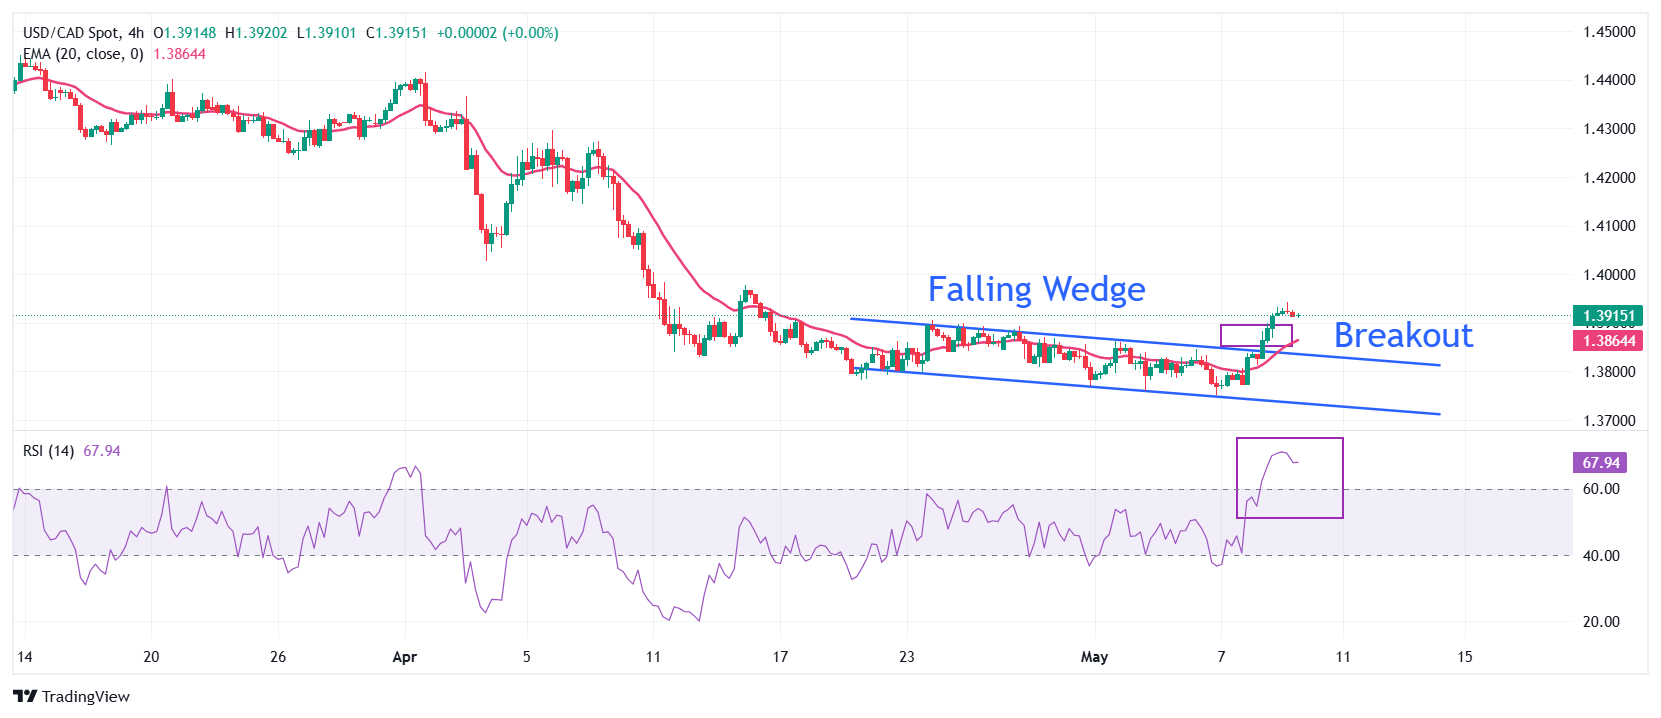
USD/CAD gains sharply after a breakout of the Falling Wedge chart pattern formed on a four-hour timeframe. Historically, a falling wedge breakout sets the stage for a bullish reversal. The pair extends its upside above the 20-period Exponential Moving Average (EMA), which is around 1.3860, indicating that the near-term trend has turned bullish.
The 14-period Relative Strength Index (RSI) rises sharply to near 66.00, suggesting a strong bullish momentum.
More upside towards the April 9 low of 1.4075, followed by the April 8 low of 1.4272 would appear if the pair breaks extend its recovery above the psychological level of 1.4000
In an alternate scenario, a downside move below the psychological support of 1.3500 and the September 24 low of 1.3430 looks likely if the pair breaks below the round level of 1.3600.
USD/CAD four-hour chart
US Dollar FAQs
The US Dollar (USD) is the official currency of the United States of America, and the ‘de facto’ currency of a significant number of other countries where it is found in circulation alongside local notes. It is the most heavily traded currency in the world, accounting for over 88% of all global foreign exchange turnover, or an average of $6.6 trillion in transactions per day, according to data from 2022. Following the second world war, the USD took over from the British Pound as the world’s reserve currency. For most of its history, the US Dollar was backed by Gold, until the Bretton Woods Agreement in 1971 when the Gold Standard went away.
The most important single factor impacting on the value of the US Dollar is monetary policy, which is shaped by the Federal Reserve (Fed). The Fed has two mandates: to achieve price stability (control inflation) and foster full employment. Its primary tool to achieve these two goals is by adjusting interest rates. When prices are rising too quickly and inflation is above the Fed’s 2% target, the Fed will raise rates, which helps the USD value. When inflation falls below 2% or the Unemployment Rate is too high, the Fed may lower interest rates, which weighs on the Greenback.
In extreme situations, the Federal Reserve can also print more Dollars and enact quantitative easing (QE). QE is the process by which the Fed substantially increases the flow of credit in a stuck financial system. It is a non-standard policy measure used when credit has dried up because banks will not lend to each other (out of the fear of counterparty default). It is a last resort when simply lowering interest rates is unlikely to achieve the necessary result. It was the Fed’s weapon of choice to combat the credit crunch that occurred during the Great Financial Crisis in 2008. It involves the Fed printing more Dollars and using them to buy US government bonds predominantly from financial institutions. QE usually leads to a weaker US Dollar.
Quantitative tightening (QT) is the reverse process whereby the Federal Reserve stops buying bonds from financial institutions and does not reinvest the principal from the bonds it holds maturing in new purchases. It is usually positive for the US Dollar.
Author

Sagar Dua
FXStreet
Sagar Dua is associated with the financial markets from his college days. Along with pursuing post-graduation in Commerce in 2014, he started his markets training with chart analysis.


