USD/CAD Price Forecast: Remains above lower ascending channel boundary near 1.4000
- USD/CAD may find the primary resistance at the nine-day EMA of 1.4025.
- The 14-day Relative Strength Index sits above 50, indicating an active bullish bias.
- Rebounds from the ascending channel’s lower boundary around 1.4000.

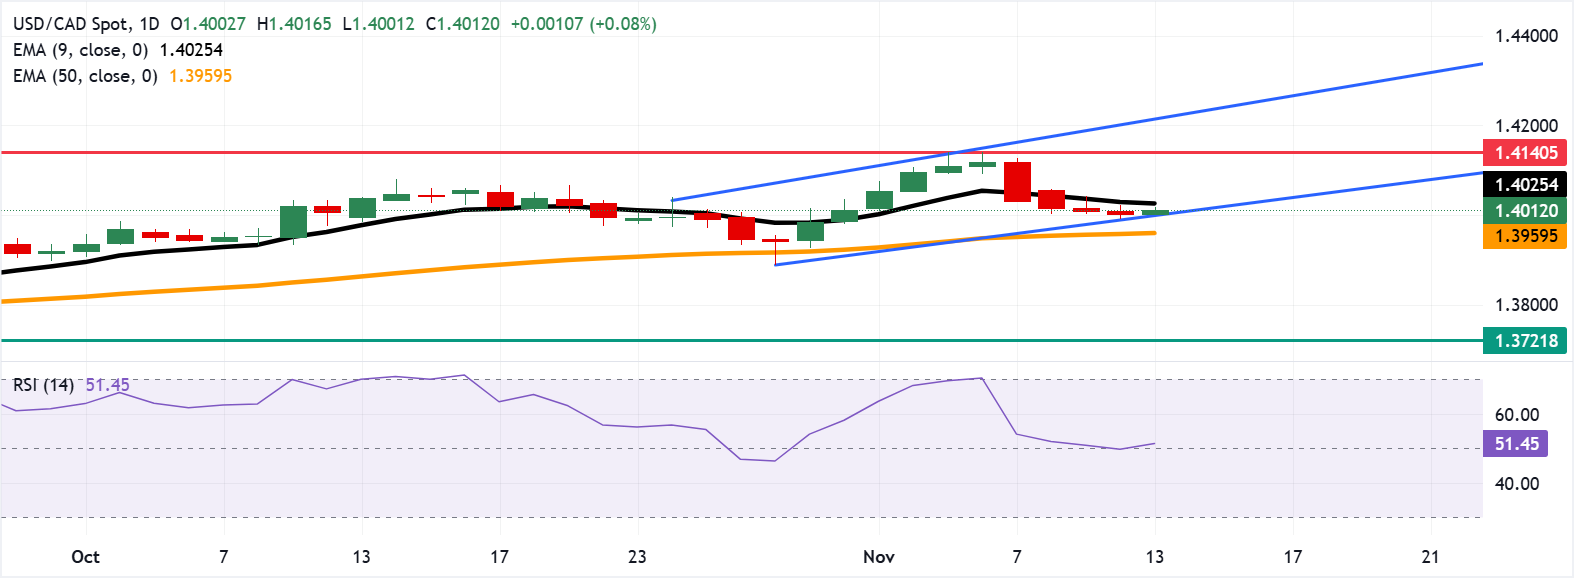
USD/CAD edges higher after four days of losses, trading around 1.4010 during the Asian hours on Thursday. The technical analysis of the daily chart indicates a prevailing bullish bias, with the pair remaining within the ascending channel pattern.
The 14-day Relative Strength Index (RSI) remains slightly above the 50 level, suggesting a bullish bias is in play. However, the short-term price momentum is weaker as the pair is positioned below the nine-day Exponential Moving Average (EMA).
The immediate resistance lies at the nine-day EMA of 1.4025. A break above this level would improve the short-term price momentum and support the USD/CAD pair may test the fresh seven-month high of 1.4140, reached on November 5. Further advance would open the doors for the pair to explore the region around the upper boundary of the ascending channel at 1.4220.
On the downside, the initial support lies around the ascending channel’s lower boundary near the psychological level of 1.4000, followed by the 50-day EMA at 1.3959. A break below this confluence support zone would cause the emergence of the bearish bias and put downward pressure on the USD/CAD pair to navigate the region around the three-month low of 1.3721, recorded on August 7.
(The story was corrected on November 13 at 07:15 GMT to say in the first paragraph that the pair is trading around 1.4010 during the Asian hours on Thursday, and not on Friday.)
Canadian Dollar Price Today
The table below shows the percentage change of Canadian Dollar (CAD) against listed major currencies today. Canadian Dollar was the weakest against the Australian Dollar.
| USD | EUR | GBP | JPY | CAD | AUD | NZD | CHF | |
|---|---|---|---|---|---|---|---|---|
| USD | 0.07% | 0.09% | 0.11% | 0.07% | -0.28% | 0.34% | 0.16% | |
| EUR | -0.07% | 0.02% | 0.05% | 0.00% | -0.35% | 0.28% | 0.10% | |
| GBP | -0.09% | -0.02% | 0.02% | -0.02% | -0.37% | 0.25% | 0.07% | |
| JPY | -0.11% | -0.05% | -0.02% | -0.07% | -0.40% | 0.19% | 0.04% | |
| CAD | -0.07% | -0.00% | 0.02% | 0.07% | -0.34% | 0.26% | 0.09% | |
| AUD | 0.28% | 0.35% | 0.37% | 0.40% | 0.34% | 0.63% | 0.46% | |
| NZD | -0.34% | -0.28% | -0.25% | -0.19% | -0.26% | -0.63% | -0.18% | |
| CHF | -0.16% | -0.10% | -0.07% | -0.04% | -0.09% | -0.46% | 0.18% |
The heat map shows percentage changes of major currencies against each other. The base currency is picked from the left column, while the quote currency is picked from the top row. For example, if you pick the Canadian Dollar from the left column and move along the horizontal line to the US Dollar, the percentage change displayed in the box will represent CAD (base)/USD (quote).
Author

Akhtar Faruqui
FXStreet
Akhtar Faruqui is a Forex Analyst based in New Delhi, India. With a keen eye for market trends and a passion for dissecting complex financial dynamics, he is dedicated to delivering accurate and insightful Forex news and analysis.


