|

USD/CAD Price Forecast: Hanging Man reversal candlestick might signal important pivot

  • USD/CAD has formed a candlestick reversal pattern on the daily chart. 
  • This could mark an important reversal in the short-term trend. 

USD/CAD is falling on Thursday, trading almost half a percentage point lower on the day, and forming a long red candlestick (see chart below). 

USD/CAD Daily Chart 


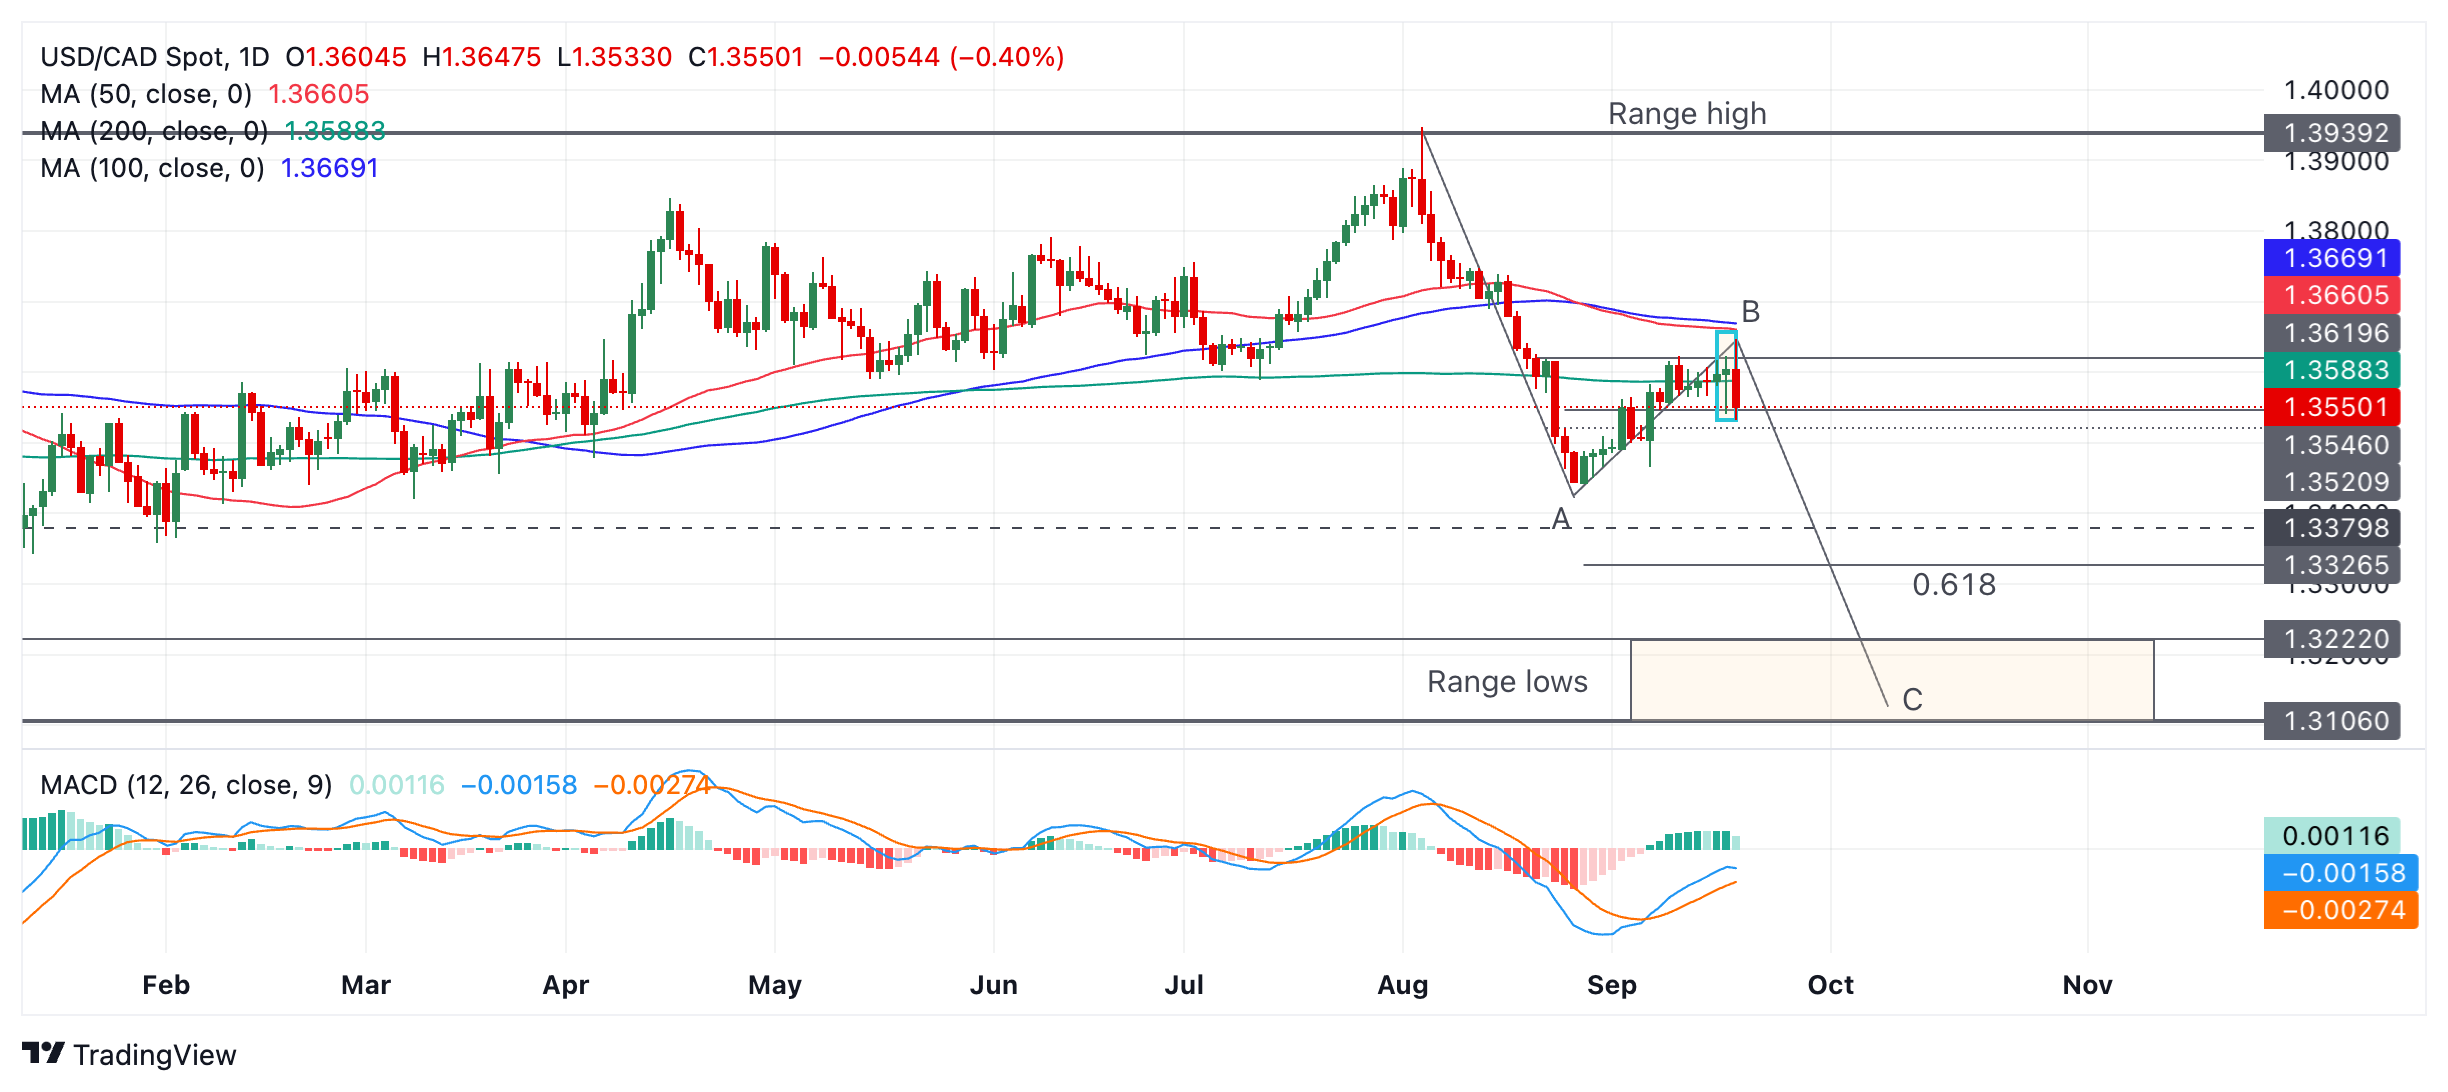
On Wednesday USD/CAD formed a bearish Hanging Man Japanese candlestick pattern (blue rectangle on chart above). This pattern forms when price rises to a new high, pulls back down during the same day, then recovers again and closes the day just below where it opened. If it is followed by a red down day, a short-term bearish reversal is confirmed. 

Thursday’s red down day so far appears to be confirming the Hanging Man. It may be highlighting a pivot point, or reversal of the rally that began at the August 28 low. 

USD/CAD is oscillating within a larger range and the overall structure of the move down from the range high appears to conform to that of an ABC pattern, or “Measured Move”. These patterns are like large zig-zags with wave C usually reaching a similar length to wave A. If USD/CAD really is forming an ABC pattern then C should end within the zone of the range lows (orange shaded rectangle on chart above). 

It is also possible the move could reach a point where wave C is a Fibonacci 0.618 ratio of the length of wave A. If so it would probably reach 1.3326. 

If Thursday ends as a bearish down day it will provide confirmation of an extension lower towards the aforesaid targets. A break below 1.3466 (September 6 low) would provide additional bearish confirmation. 

Author

Joaquin Monfort

Joaquin Monfort is a financial writer and analyst with over 10 years experience writing about financial markets and alt data. He holds a degree in Anthropology from London University and a Diploma in Technical analysis.

More from Joaquin Monfort
Share:

Editor's Picks

EUR/USD climbs to daily highs near 1.1820

EUR/USD now picks up pace and advances to the area of daily peaks north of the 1.1800 barrier at the end of the week. The pair’s decent move higher comes against the backdrop of a generalised lack of direction in the FX galaxy and the mild offered stance in the US Dollar.

GBP/USD trims losses, retests 1.3460

After briefly challenging its key 200-day SMA near 1.3440, GBP/USD now manages to regain some balance and revisit the 1.3460 zone on Friday. Cable’s pullback comes as the selling pressure on the Greenback gathers traction, reigniting some recovery in the risk-linked space.

Gold flirts with four-week highs past $5,200

Gold extends its rebound, climbing for a third consecutive session and pushing back above the $5,200 mark per troy ounce on Friday. The move higher continues to draw support from lingering geopolitical tensions and the ongoing uncertainty surrounding US trade policy, both of which are keeping safe-haven demand firmly in play.

Bitcoin, Ethereum and Ripple consolidate with short-term cautious bullish bias

Bitcoin, Ethereum and Ripple are consolidating near key technical areas on Friday, showing mild signs of stabilization after recent volatility. BTC holds above $67,000 despite mild losses so far this week, while ETH hovers around $2,000 after a rejection near its upper consolidation boundary. 

Changing the game: International implications of recent tariff developments

The Supreme Court ruling on International Emergency Economic Powers Act (IEEPA) tariffs provides limited relief for the rest of the world, with weighted average tariff rates modestly lower.

Starknet unveils strkBTC, shielded Bitcoin transactions on Ethereum Layer 2

Starknet, the Ethereum Layer 2 network developed by StarkWare, today announced strkBTC, a wrapped Bitcoin asset that introduces optional shielding while preserving full DeFi composability.