|

USD/CAD Price Analysis: Maintains position above 1.3650 due to weakening bearish bias

  • USD/CAD could extend its gains as the 14-day RSI indicates a momentum shift toward the upside.
  • The momentum indicator MACD also suggests a weakening bearish bias as converging below the signal line.
  • A break below the 1.3600 could exert downward pressure on the pair.

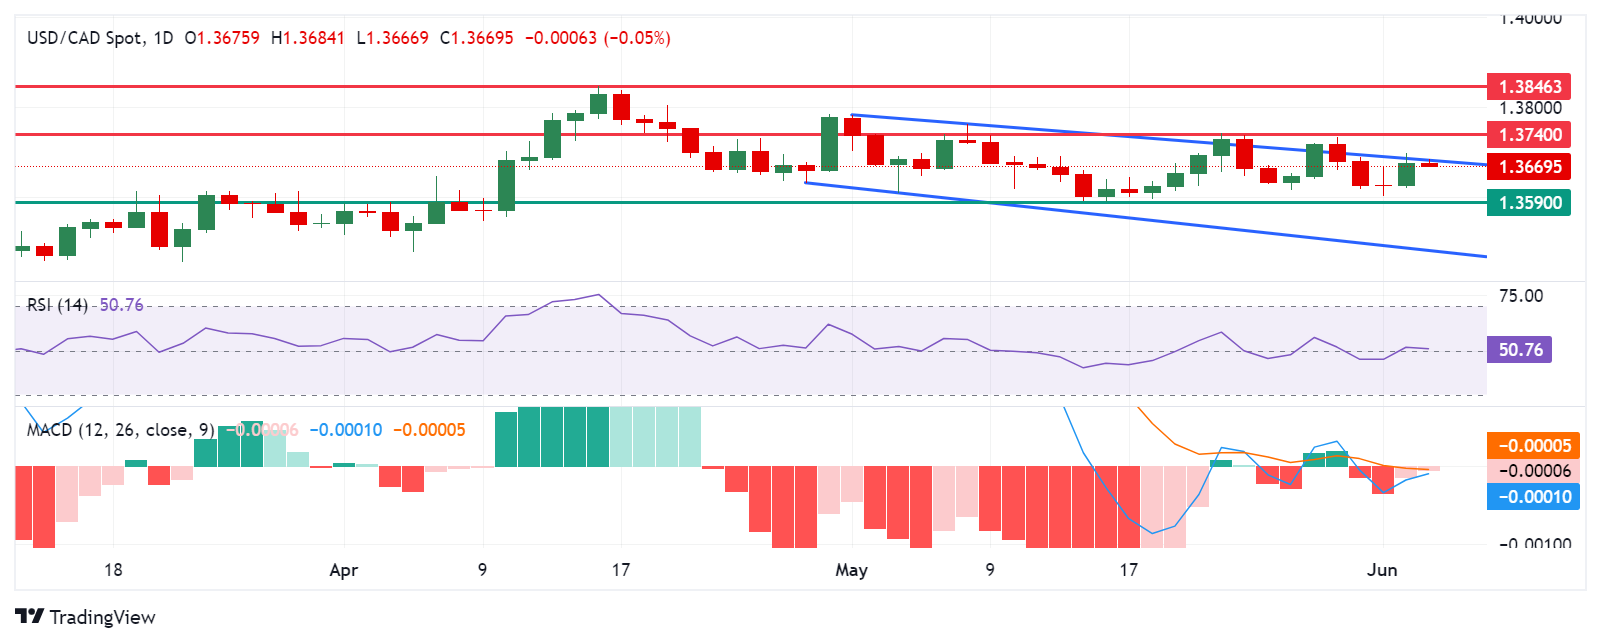
USD/CAD treads water to continue its gains for the second consecutive session, trading around 1.3680 during the European hours on Wednesday. Analysis of the daily chart suggests a bearish bias for the USD/CAD pair, as it remains within a descending channel. However, the 14-day Relative Strength Index (RSI) has slightly moved above the 50 level, and further upward movement may indicate a weakening of this bearish bias.

The Moving Average Convergence Divergence (MACD) indicator suggests a potential momentum shift for the USD/CAD pair. While the MACD line is positioned below the centerline, it shows convergence below the signal line. A break above the centerline could further weaken the bearish trend.

The USD/CAD pair could find key support around the psychological level of 1.3600 and the throwback support at 1.3590. A break below the latter could exert downward pressure on the pair, leading it to test the psychological level of 1.3500, followed by the lower threshold of the descending channel.

On the upside, the USD/CAD pair could break above the upper boundary of the descending channel, followed by a psychological level of 1.3700 and a pullback resistance of 1.3740. A breakthrough above this resistance could lead the pair to explore the region around the key level of 1.3800, followed by April’s high of 1.3846.

USD/CAD: Daily Chart

USD/CAD

Overview
Today last price1.3683
Today Daily Change0.0007
Today Daily Change %0.05
Today daily open1.3676
 
Trends
Daily SMA201.366
Daily SMA501.3663
Daily SMA1001.3583
Daily SMA2001.3576
 
Levels
Previous Daily High1.3699
Previous Daily Low1.3621
Previous Weekly High1.3735
Previous Weekly Low1.3615
Previous Monthly High1.3783
Previous Monthly Low1.359
Daily Fibonacci 38.2%1.3669
Daily Fibonacci 61.8%1.3651
Daily Pivot Point S11.3631
Daily Pivot Point S21.3587
Daily Pivot Point S31.3553
Daily Pivot Point R11.371
Daily Pivot Point R21.3744
Daily Pivot Point R31.3788

Author

Akhtar Faruqui

Akhtar Faruqui is a Forex Analyst based in New Delhi, India. With a keen eye for market trends and a passion for dissecting complex financial dynamics, he is dedicated to delivering accurate and insightful Forex news and analysis.

More from Akhtar Faruqui
Share:

Editor's Picks

AUD/USD bounces off weekly low on Israel-Lebanon ceasefire

AUD/USD recovers slightly from the weekly low during the Asian session on Thursday as a new Israel-Lebanon ceasefire keeps a lid on the safe-haven US Dollar. Meanwhile, the US and Iran remain at odds over key issues, which, along with hawkish Fed expectations, act as a tailwind for the buck. Furthermore, diminishing odds of an RBA rate hike in June cap the currency pair as traders keenly await the US NFP report on Friday.

USD/JPY remains close to 160.00 intervention threshold on Mideast tensions

USD/JPY struggles to find acceptance above 160.00 and retreats from a one-month high during the Asian session on Thursday amid fears that authorities will step in again to prop up the Japanese Yen. Furthermore, a new Israel-Lebanon ceasefire caps the US Dollar and supports the currency pair. However, renewed US-Iran tensions favor the USD bulls amid Fed rate hike bets and also hold back the JPY bulls from placing aggressive bets amid economic risks stemming from the Middle East conflict, suggesting that dips are likely to be bought into.

Gold bounces off one-week low; upside seems capped on Iran uncertainty

Gold recovers from a one-week low touched during the Asian session on Thursday, as news of an Israel-Lebanon ceasefire acts as a headwind for the safe-haven US Dollar. However, renewed hostilities in the Gulf, along with stalled US-Iran peace talks, keep geopolitical risks in play and should support the USD. Moreover, US-Iran tensions remain supportive of higher Crude Oil prices, fueling inflationary concerns and bolstering bets for higher interest rates for longer. This should cap the non-yielding bullion and warrants caution for bulls.


Bitcoin drops below $65K amid reinforced bear market signals

Bitcoin dipped further below $65,000 on Wednesday, with onchain data from Glassnode signaling a market firmly in a bear phase. The decline has pushed prices back into a key valuation range between the Realized Price and the True Market Mean. Glassnode noted that a key shift in market structure has also emerged.

The upside-down math of debt
In 2010, Professors Carmen Reinhart and Kenneth Rogoff published a paper, Growth in a Time of Debt, which instantly went viral. The main thesis of the paper was that once a government's debt-to-GDP ratio crosses above 90%, a financial crisis and default are around the corner.
Recession on paper: What really moves the Canadian Loonie now?

Statistics Canada handed the headline writers a gift and the analysts a headache. Real GDP shrank 0.1% on an annualized basis in the first quarter, and with the fourth quarter of 2025 revised down to a 1.0% contraction, that is two negative quarters in a row, the textbook definition of a technical recession and Canada's first since the pandemic.