|

USD/CAD Price Analysis: Clings to recovery gains, remains below mid-1.2300s

  • USD/CAD staged a modest recovery from multi-month lows touched earlier this Thursday.
  • The risk-off impulse, elevated US bond yields provided a goodish lift to the safe-haven USD.
  • Retreating crude oil prices undermined the loonie and remained supportive of the momentum.

The USD/CAD pair showed some resilience below the 1.2300 round-figure mark and stage a goodish intraday bounce from four-month lows touched earlier this Thursday. The pair held on to its modest recovery gains through the mid-European session and was last seen hovering near daily tops, just below mid-1.2300s.

The risk-off impulse in the markets helped revive demand for the safe-haven US dollar, which further benefitted from elevated US Treasury bond yields. Apart from this, a modest pullback in crude oil prices from multi-year tops weighed on the commodity-linked loonie and triggered a short-covering around the USD/CAD pair.

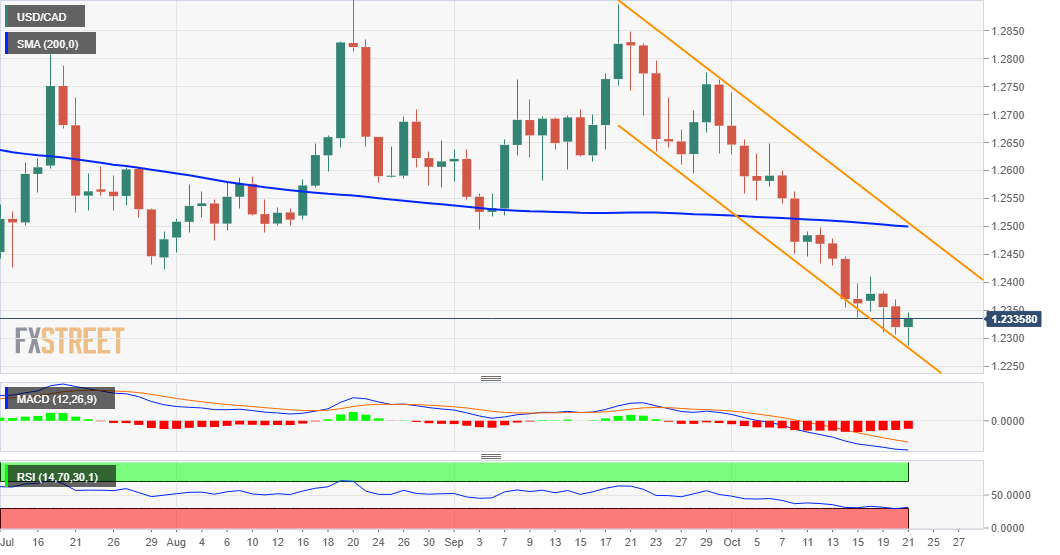
From a technical perspective, oversold RSI (14) on the daily chart prompted bearish traders to take some profits off the table near the lower boundary of a short-term descending channel. The mentioned support, around the 1.2290-85 area, should act as a pivotal point for traders and help determine the near-term trajectory.

A convincing break below will mark a fresh bearish breakdown and turn the USD/CAD pair vulnerable to prolong its bearish trend witnessed over the past one month or so. The subsequent slide could get extended towards the next relevant support near mid-1.2300s before the pair eventually drops to the 1.2300 round-figure mark.

On the flip side, any further recovery is likely to confront resistance near the 1.2375-80 region ahead of the 1.2400 mark. Some follow-through buying should pave the way towards a confluence hurdle near the key 1.2500 psychological mark, comprising of the very important 200-day SMA and the top end of the mentioned channel.

USD/CAD daily chart

fxsoriginal

Technical levels to watch

USD/CAD

Overview
Today last price1.2341
Today Daily Change0.0021
Today Daily Change %0.17
Today daily open1.232
 
Trends
Daily SMA201.2534
Daily SMA501.2607
Daily SMA1001.2509
Daily SMA2001.2501
 
Levels
Previous Daily High1.237
Previous Daily Low1.2307
Previous Weekly High1.2498
Previous Weekly Low1.2337
Previous Monthly High1.2896
Previous Monthly Low1.2494
Daily Fibonacci 38.2%1.2331
Daily Fibonacci 61.8%1.2346
Daily Pivot Point S11.2295
Daily Pivot Point S21.227
Daily Pivot Point S31.2233
Daily Pivot Point R11.2357
Daily Pivot Point R21.2395
Daily Pivot Point R31.242

Author

Haresh Menghani

Haresh Menghani is a detail-oriented professional with 10+ years of extensive experience in analysing the global financial markets.

More from Haresh Menghani
Share:

Editor's Picks

EUR/USD extends losses toward 1.1600 ahead of EU inflation data

EUR/USD extends the decline toward 1.1600 in the European session on Tuesday. The pair remains under pressure as surging energy prices amid the US-Iran war have increased the risks of higher inflation for the Old Continent. The focus is now on the Eurozone preliminary inflation reading for February. 

GBP/USD attacks 1.3300, refreshing three-month lows

GBP/USD is deep in the red near 1.3300, accelerating its downside to renew three-month lows in European trading on Tuesday. The ongoing escalation in the Iran war, combined with rising Oil prices, weighs negatively on the higher-yielding Pound Sterling as the US Dollar capitalizes on increased haven demand.

Gold falls below $5,300 as stronger USD counter Middle East woes

Gold attracts some intraday selling and falls below $5,300 on Tuesday. The US Dollar climbs to a fresh high since January 20 and turns out to be a key factor exerting downward pressure on the commodity. However, concerns about a broader regional conflict in the Middle East continue to weigh on investors' sentiment and underpin demand for the traditional safe-haven bullion.

Stellar risks deeper losses as derivatives metrics turn negative

Stellar is trading red below $0.16 at the time of writing on Tuesday, after a slight recovery the previous day. Weakening derivatives data caps the recovery, while an unfavorable technical outlook projects a deeper correction for the XLM token in the upcoming days.

The market is not panicking it is repricing the probability distribution of Oil and time

At the end of the day, markets do not trade morality or geopolitics. They trade transmission channels. And the only channel that truly matters in this maelstrom runs through the price of energy and the time value of money.

Hyperliquid Price Forecast: HYPE rises on commodities demand amid US-Iran war

Hyperliquid (HYPE) steadies above $33 at press time on Tuesday, marking its fourth consecutive day of recovery in a broadly volatile market due to the ongoing US-Israel strikes on Iran.