USD/CAD Price Analysis: Bulls on the lookout for a significant correction from demand area
- USD/CAD is moving in on a daily support area.
- The bulls will be looking out for a bullish structure from the lower time frames.

USD/CAD's M-formation is a compelling feature on the daily chart as the price moves in on a key area of what could be a demand area.
USD/CAD daily chart
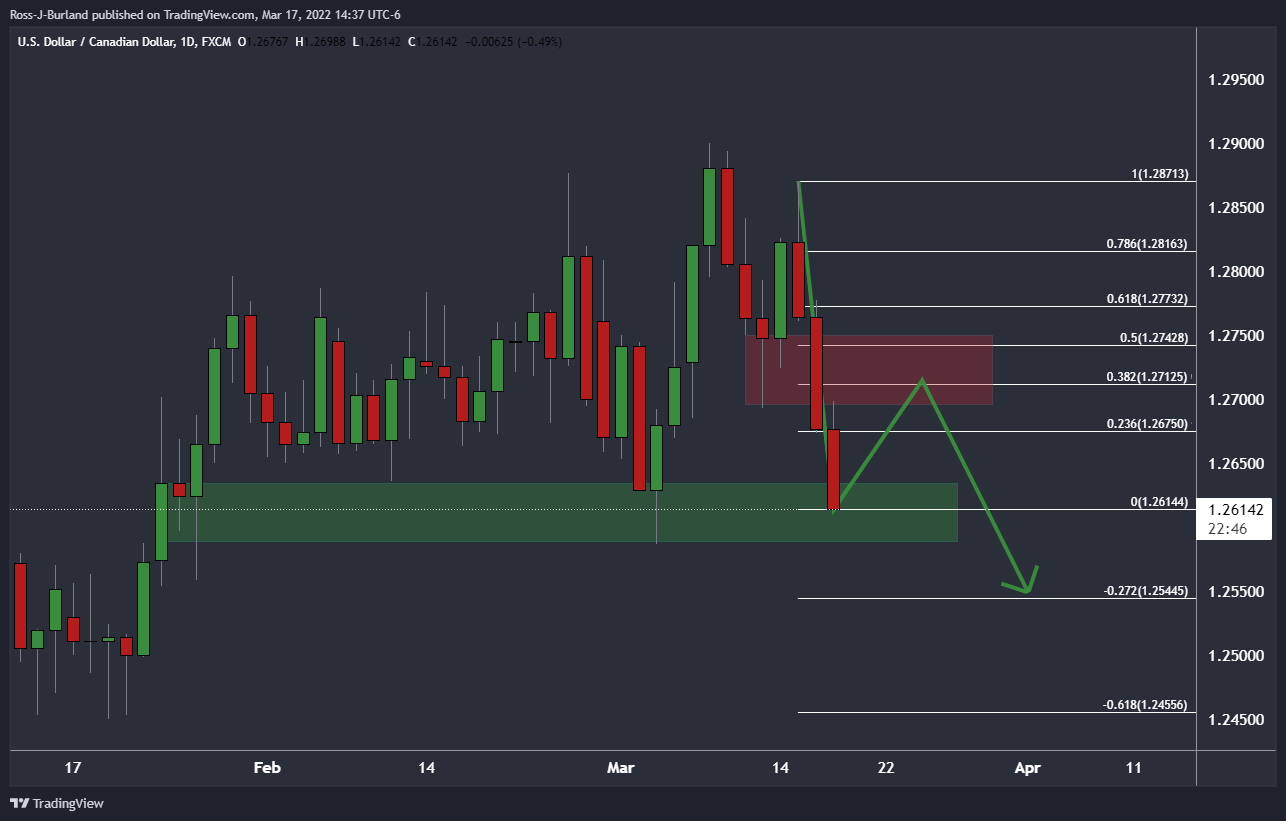
Should this turn out to be the case, then there will be a strong bias towards the 1.27 area and the Fibonacci scales, starting with the 38.2% ratio and then the 50% mean reversion point near the neckline of the M-pattern and 1.2750.
USD/CAD H1 chart
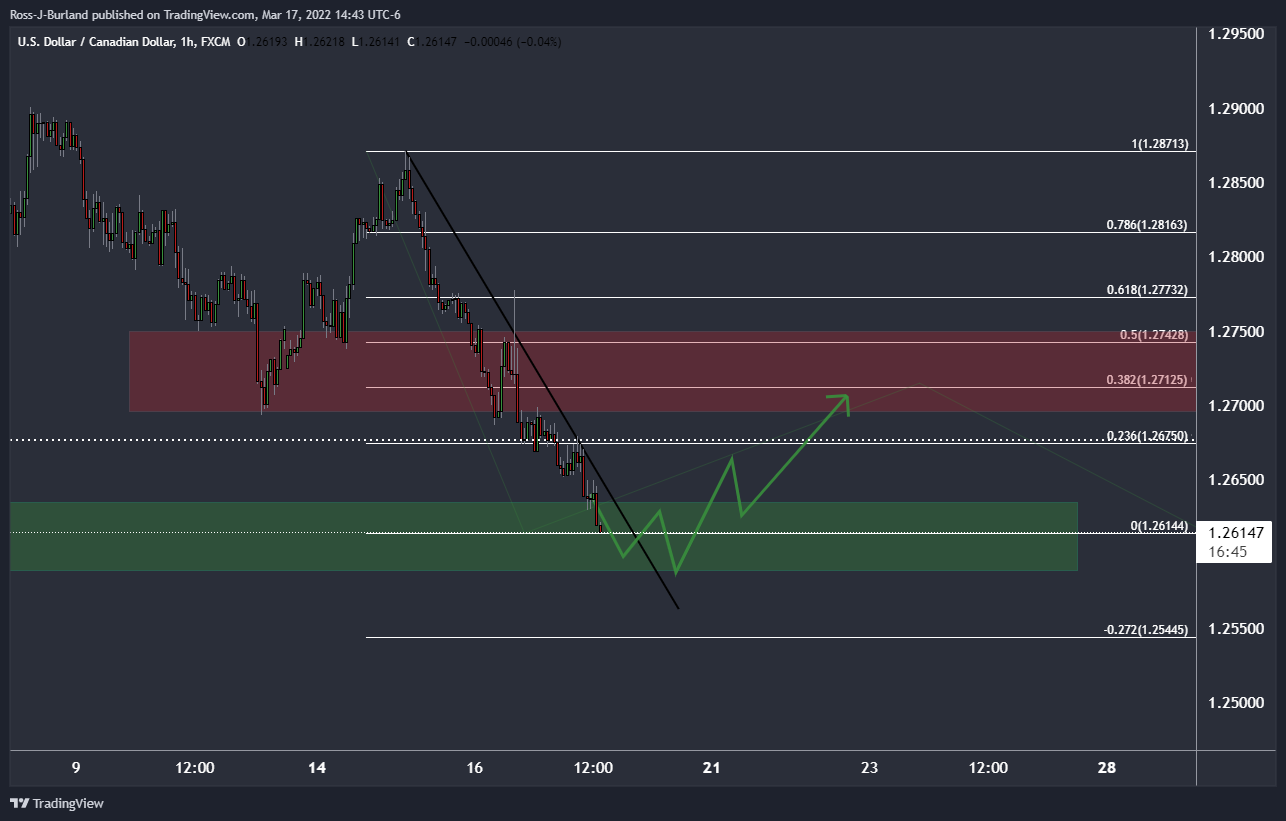
The hourly chart offers a compelling outlook as well. There are still prospects of lower levels at this juncture for the momentum remains with the bears so far. However, the moment this slows and the trajectory decelerates, traders can be on the lookout for a kindred schematic in the price action as illustrated above.
This illustration forecasts a break of the trendline resistance and retest of the breakout structure prior to a continuation to the upside. This would ultimately equate to a correction of the daily bearish impulse and a reversion towards the M-formation's neckline.
Author

Ross J Burland
FXStreet
Ross J Burland, born in England, UK, is a sportsman at heart. He played Rugby and Judo for his county, Kent and the South East of England Rugby team.


