|

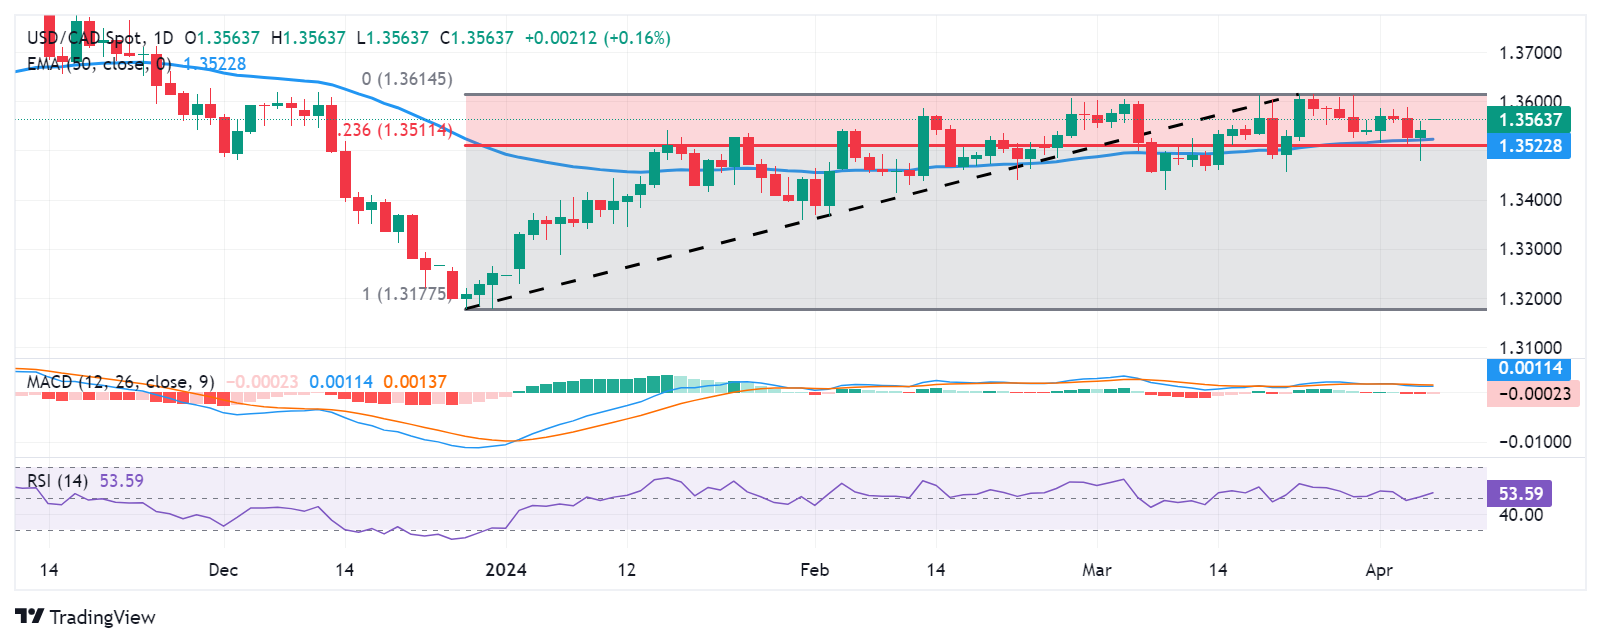
USD/CAD Price Analysis: Advances to near 1.3560 followed by weekly high

  • USD/CAD may find an immediate resistance area around the weekly high of 1.3588 and psychological level of 1.3600.
  • A break above March’s high of 1.3614 could lead the pair to meet the major barrier of 1.3650.
  • The immediate support appears at 1.3550, followed by the 50-day EMA at 1.3522.

USD/CAD extends its gains for the second consecutive session, trading higher around 1.3560 during the European session on Friday. The immediate barrier appears at a weekly high of 1.3588, followed by the psychological resistance at 1.3600 level.

A breakthrough above the psychological mark could prompt the USD/CAD pair to test March’s high of 1.3614 to approach the major barrier at the 1.3650 level.

The 14-day Relative Strength Index (RSI) is positioned above 50, suggesting bullish momentum. However, the Moving Average Convergence Divergence (MACD) suggests a tepid momentum.

The MACD line is above the centerline, indicating bullish momentum, but there is divergence below the signal line. Traders may await confirmation from the MACD, a lagging indicator, to determine the direction of the trend.

On the downside, the USD/CAD pair could find immediate support at 1.3550, followed by the 50-day Exponential Moving Average (EMA) at 1.3522 and the 23.6% Fibonacci retracement level of 1.3511.

A break below the latter could exert downward pressure on the USD/CAD pair to surpass the psychological level of 1.3500 to retest the weekly low at 1.3477 level.

USD/CAD: Daily Chart

USD/CAD

Overview
Today last price1.3564
Today Daily Change0.0022
Today Daily Change %0.16
Today daily open1.3542
 
Trends
Daily SMA201.3539
Daily SMA501.3513
Daily SMA1001.3487
Daily SMA2001.3503
 
Levels
Previous Daily High1.3559
Previous Daily Low1.3478
Previous Weekly High1.3614
Previous Weekly Low1.3525
Previous Monthly High1.3614
Previous Monthly Low1.342
Daily Fibonacci 38.2%1.3528
Daily Fibonacci 61.8%1.3509
Daily Pivot Point S11.3494
Daily Pivot Point S21.3445
Daily Pivot Point S31.3413
Daily Pivot Point R11.3575
Daily Pivot Point R21.3608
Daily Pivot Point R31.3656

Author

Akhtar Faruqui

Akhtar Faruqui is a Forex Analyst based in New Delhi, India. With a keen eye for market trends and a passion for dissecting complex financial dynamics, he is dedicated to delivering accurate and insightful Forex news and analysis.

More from Akhtar Faruqui
Share:

Editor's Picks

EUR/USD hits fresh 2026 lows near 1.1570

EUR/USD adds to Monday’s heavy losses and reaches new yearly lows around 1.1570 on Tuesday. The pair’s deep pullback comes as the US Dollar extend its strong bounce, always propped up by the intense flight-to-safety environment amid the deteriorating geopolitical landscape in the Middle East.

GBP/USD attacks 1.3300, refreshing three-month lows

GBP/USD is deep in the red near 1.3300, accelerating its downside to renew three-month lows in European trading on Tuesday. The ongoing escalation in the Iran war, combined with rising Oil prices, weighs negatively on the higher-yielding Pound Sterling as the US Dollar capitalizes on increased haven demand.

Gold meets buyers around $5,000, remains under pressure

Gold comes under renewed and marked selling pressure on Tuesday, dangerously approaching the critical $5,000 mark per troy ounce, reversing at the same time four consecutive daily advances. The yellow metal’s bearish tone comes on the back of the increasing demand for the Greenback and investors’ repricing of Fed rate cuts.

Crypto Today: Bitcoin, Ethereum, XRP pull back as sentiment remains in extreme market fear

The cryptocurrency market is broadly in the red on Tuesday as the Middle East grapples with an escalating war. Bitcoin (BTC) is in a pullback, trading below $67,000 at the time of writing, and most altcoins follow suit.

Energy shock 2.0: Why rising Gas prices could hit the Euro

Even without a confirmed, sustained disruption, the mere risk to a key global energy chokepoint is enough to inject a significant premium into European Gas markets. And for the Euro, that matters.

Ripple falters amid sell-off jitters and negative funding rates

Ripple (XRP) has come under pressure, drifting lower to $1.35 at the time of writing on Tuesday. The over 2% correction looks poised to erase the previous day’s gains, which lifted the remittance token to $1.42.