US Indices July seasonality vs chart analysis amid tariff uncertainties

Key analysis of Dow Jones Industrial vs Nasdaq 100 vs S&P 500:
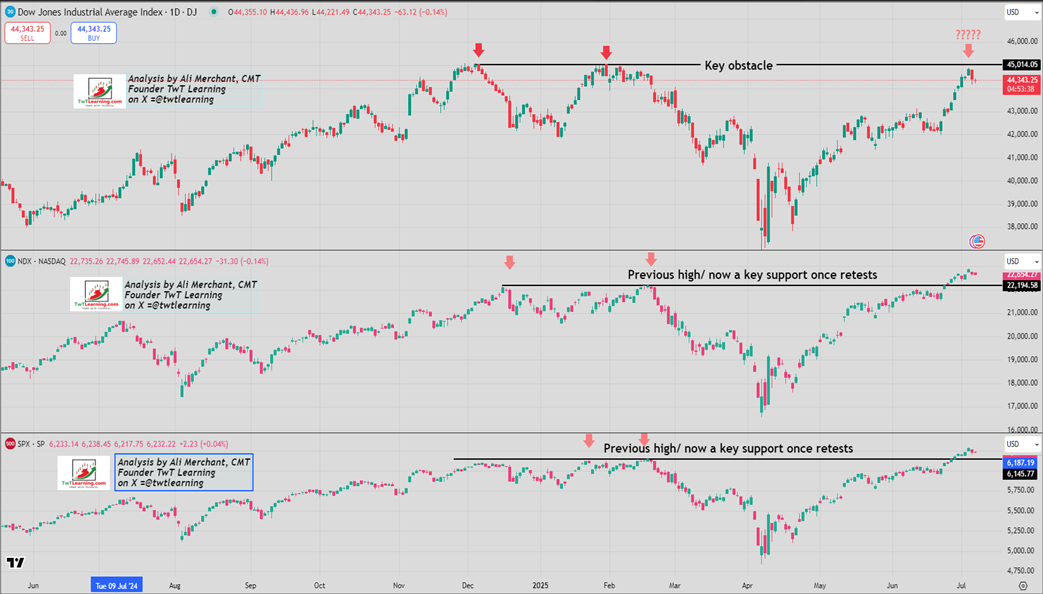
- DJI is challenging a key obstacle which is the all-time high around 45000.
- So far 45K has contained the rallies and as long as it remains intact, a dip to 43950 to 43850 is on the way.
- NDX recorded a new high last week on July 03 at 22,896 surpassing the previous high registered on February 19, 2025, at 22,2261.
- Similarly, SPX recorded a new high last week on July 03 at 6284.85 penetrating the previous high registered on February 19, 2025, at 6147.43.
- A key observation looking at the following charts suggests that DJI gives an early warning for any corrective decline.
- DJI formed an all-time high in early December 2024 and retested the levels in late January 2025 providing an early warning.
- While NDX and SPX lagged by a couple of weeks in putting the previous all-time highs in February 2025.
Trade tariffs impact:
- President Trump has extended the deadline for reciprocal tariffs, which delays the certainty that businesses were hoping for this week.
- Economists expect that increased tariffs and ongoing uncertainty will hinder global economic growth, with the United States experiencing a more pronounced slowdown.
- Global financial markets are going through extreme uncertainty while business are holding investments decisions.
- Markets are going through the phase of uncertainty followed by another phase of uncertainty.
With uncertainty comes opportunity:
July US Indices Seasonality shows quite a different picture:
- Week July 07 to 11, 2025 seasonality shows all five trading days to be based on the historical pattern analysis, see the following “Market Probability Map” produced on a weekly basis.
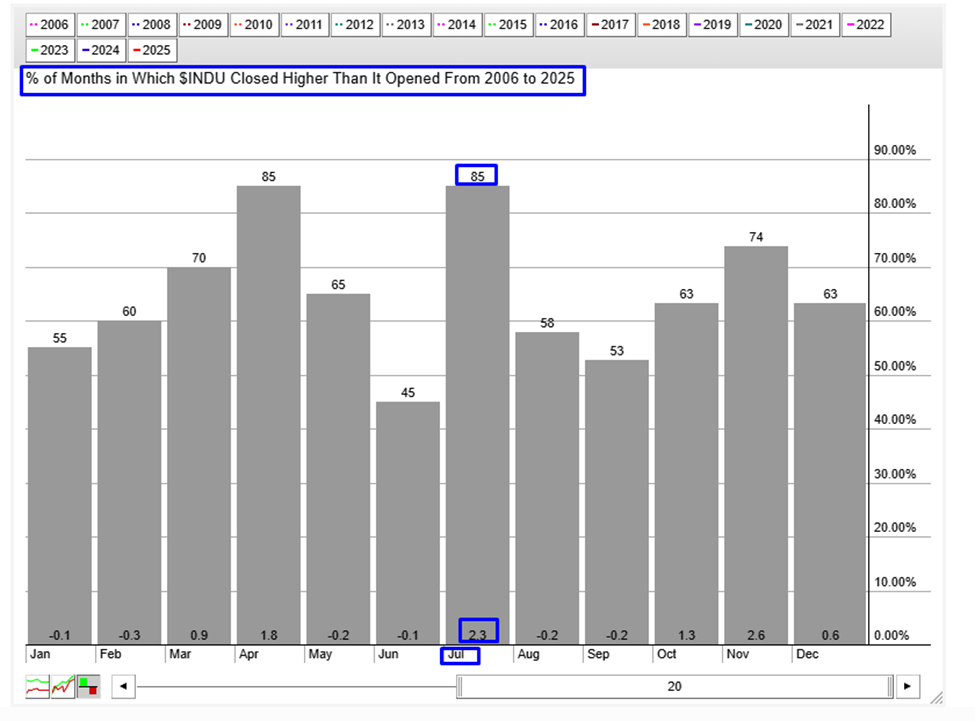
Dow Jones Industrial Index July seasonality suggests that the index closes 2.3% higher 85% of the time since 2006.
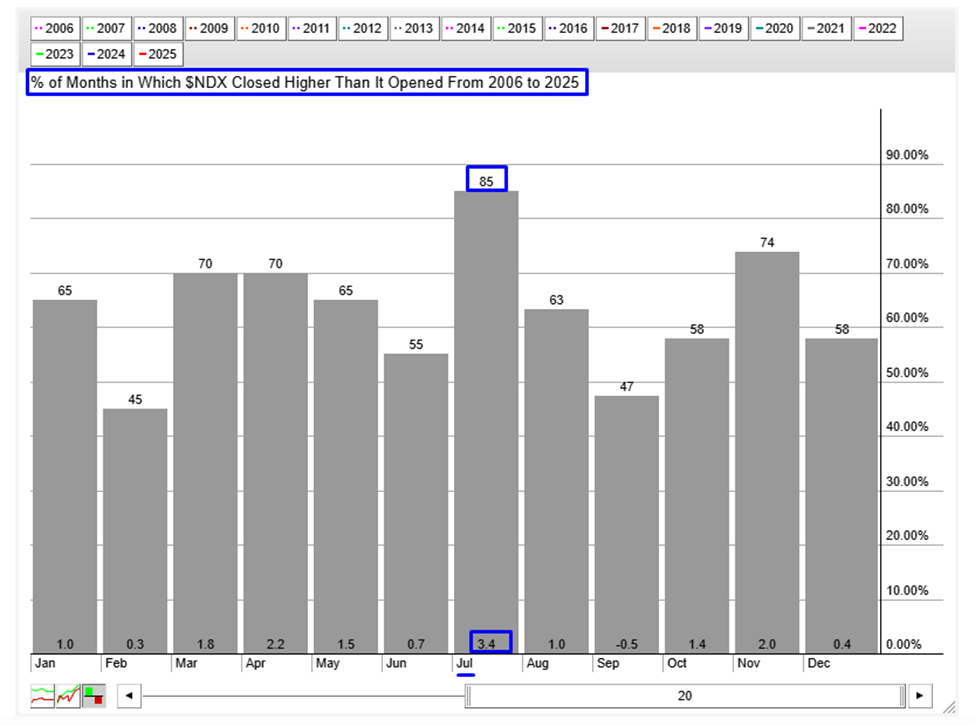
Nasdaq 100 Index July seasonality suggests that the index closes 3.4% higher 85% of the time since 2006.
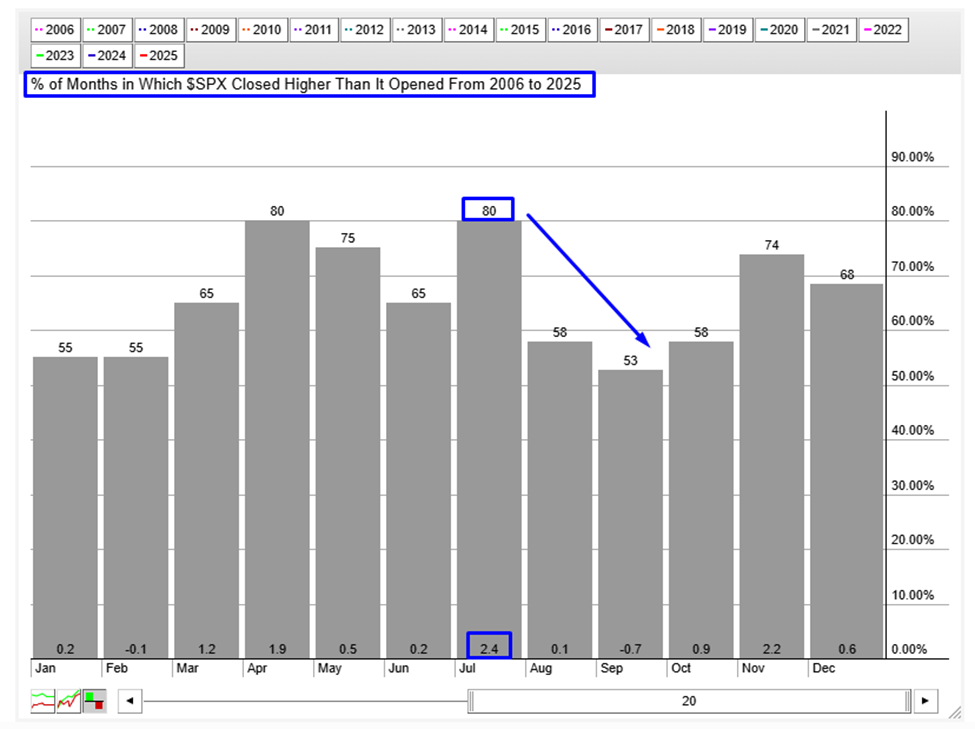
S&P 500 Index July seasonality suggests that the index closes 2.3% higher 85% of the time since 2006.
A word of wisdom:
“Investing is all about probabilities, and just because there appears to be a strong consensus prices are going to keep going up, does not mean that is wrong, or right. The consensus does tend to be wrong at the turning points, being invariably bullish at the top and bearish at the bottom.” By Bill Miller.
Author

Ali Merchant, CMT
TwT Learning
Ali Merchant is a seasoned financial market professional with expertise in Technical Analysis, Treasury & Capital Markets, Trading, Sales, Research, Training, & Fund Management, He has been trading FX, FX options, US stock


