US Dollar Technical Analysis: DXY bears bracing for the drop to 95.70 target

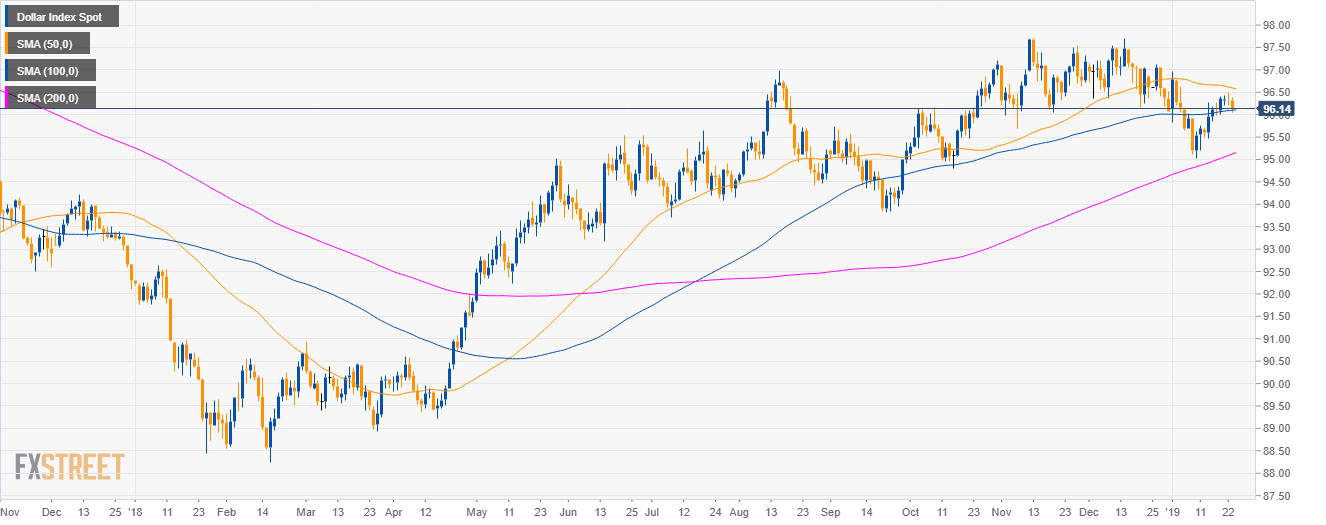
DXY daily chart
- The US Dollar Index (DXY) is in a bull trend above 200-day simple moving average (SMA).
- Bears have momentarily retaken the 50 SMA.
- As anticipated yesterday, the bears took control of the market and brought DXY almost to the 96.00 bear target.
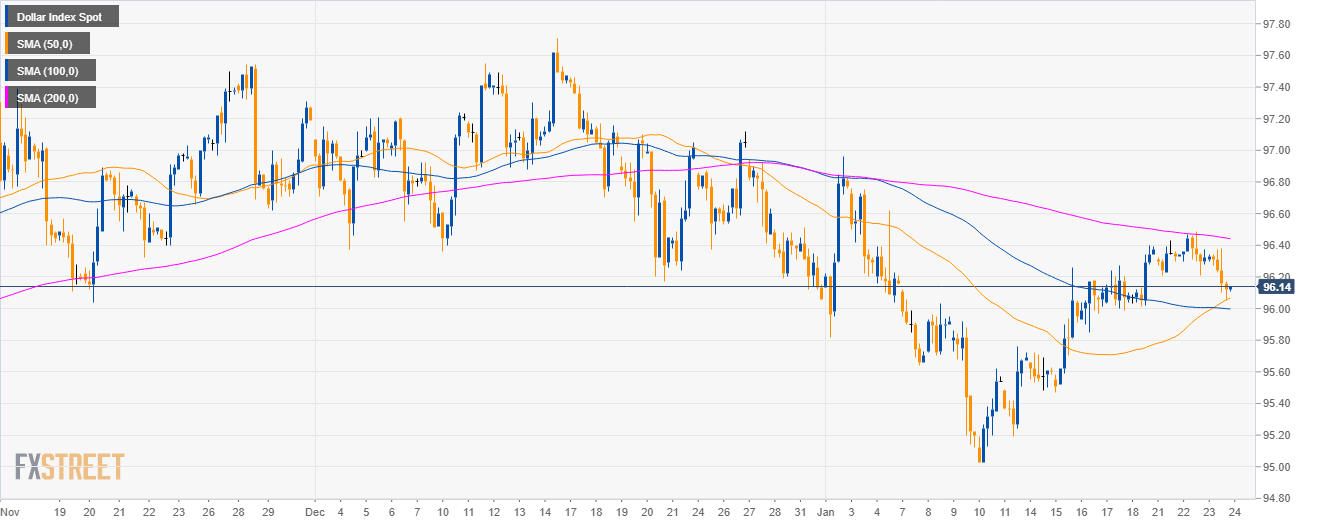
DXY 4-hour chart
- The market rejected the 200 SMA and it is now testing the 50 SMA.
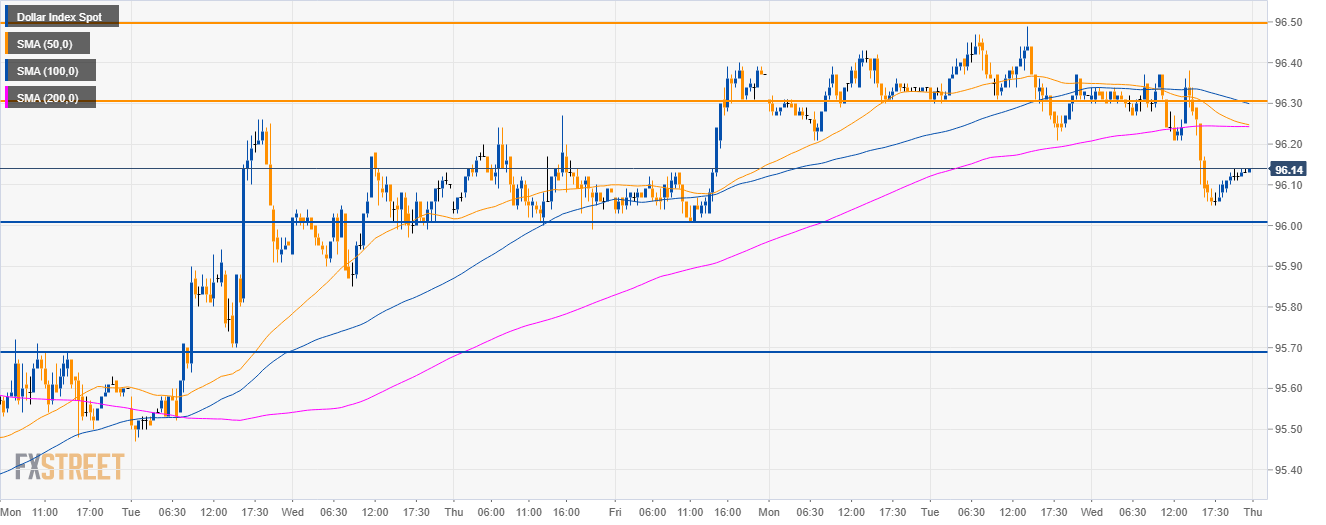
DXY 30-minute chart
- Bears broke below 96.30 support and the 200 SMA suggesting bearish momentum.
- When 96.00 figure gets broken to the downside, the market should continue its decline towards 95.70 bear target.
- Resistance to the upside is seen at the 95.70 and 96.50 level.
Additional key levels
Dollar Index Spot
Overview:
Today Last Price: 96.14
Today Daily change: -19 pips
Today Daily change %: -0.20%
Today Daily Open: 96.33
Trends:
Daily SMA20: 96.14
Daily SMA50: 96.62
Daily SMA100: 96.09
Daily SMA200: 95.09
Levels:
Previous Daily High: 96.49
Previous Daily Low: 96.21
Previous Weekly High: 96.4
Previous Weekly Low: 95.47
Previous Monthly High: 97.71
Previous Monthly Low: 96.06
Daily Fibonacci 38.2%: 96.32
Daily Fibonacci 61.8%: 96.38
Daily Pivot Point S1: 96.2
Daily Pivot Point S2: 96.06
Daily Pivot Point S3: 95.92
Daily Pivot Point R1: 96.48
Daily Pivot Point R2: 96.62
Daily Pivot Point R3: 96.76
Author

Flavio Tosti
Independent Analyst


