US Dollar marginally weaker on Monday as markets await US GDP data
- US Dollar struggles to gather strength but losses remain limited for now.
- Key macroeconomic data releases from the United States this week could drive USD valuation.
- US Dollar Index remains technically bearish in the near term.
The US Dollar (USD) failed to benefit from the stronger-than-expected S&P Global PMI surveys on Friday and the US Dollar Index closed the previous week virtually unchanged. At the beginning of the new week, the USD stays under modest selling pressure against its rivals. Ahead of the key macroeconomic data releases later in the week, including the first quarter Gross Domestic Product (GDP) and April Personal Consumption Expenditures (PCE) Price Index, investors could refrain from betting on further USD weakness.
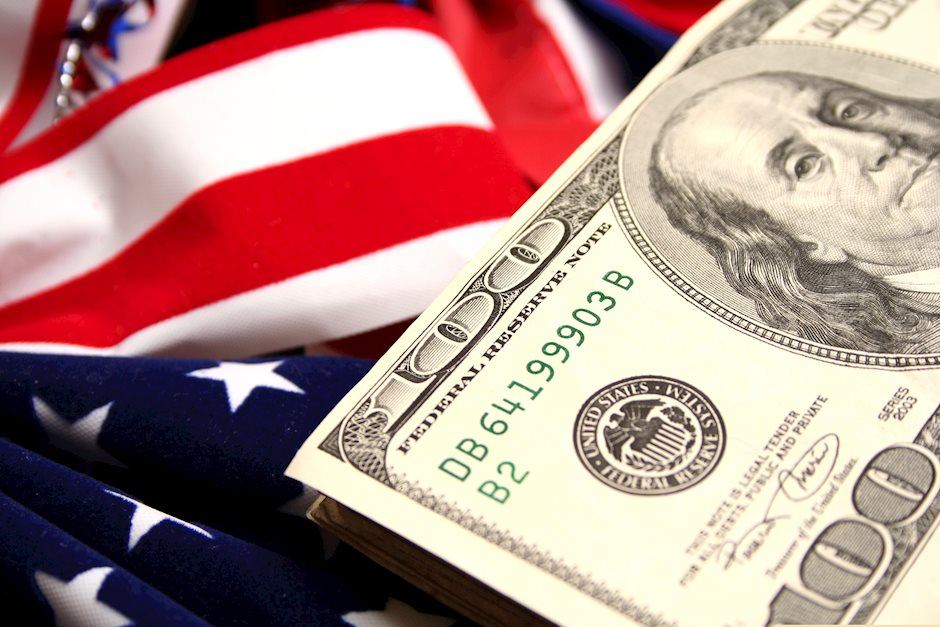
The US Dollar Index, which tracks the USD performance against a basket of six major currencies, trades modestly lower on the day, slightly above 101.50.
Daily digest market movers: US Dollar on the back foot
- The data from the US revealed on Friday that the economic activity in the private sector expanded at a strengthening pace in April with S&P Global Composite PMI rising to 53.5 (flash) from 52.3 in March.
- S&P Global Manufacturing PMI improved to 50.4 in the same period from 49.2 and Services PMI rose to 53.7, surpassing analysts' forecast of 51.5.
- Commenting on the data, "the latest survey adds to signs that business activity has regained growth momentum after contracting over the seven months to January," noted Chris Williamson, Chief Business Economist at S&P Global Market Intelligence.
- Wall Street's main indexes opened mixed on Monday but were last seen trading modestly lower on the day.
- 10-year US Treasury bond yield continues to push lower toward 3.5%.
- US Census Bureau revised March Retail Sales data to -0.6% from -1%
- The Federal Reserve Bank of Chicago announced that the National Activity Index remained unchanged at -0.19 in March. This reading came in weaker than the market expectation of -0.02 but failed to trigger a noticeable market reaction.
- The Federal Reserve Bank of Dallas' Texas Manufacturing Survey showed that the headline Business Index slumped to -223.4 in April from -15.7 in March.
- The CME Group FedWatch Tool shows that markets are currently pricing a nearly 90% probability of one more 25 basis points Federal Reserve (Fed) rate hike at the upcoming meeting.
- The Fed will be in the blackout period until the policy decisions are announced next week, May 3.
- The Conference Board's Consumer Sentiment Index data for April will be featured in the US economic docket on Tuesday.
- The US Bureau of Economic Analysis will unveil the first estimate of first-quarter GDP growth on Thursday. The US economy is forecast to expand at an annualized rate of 2% in Q1, down from the 2.6% recorded in the last quarter of 2022.
Technical analysis: US Dollar Index struggles to shake off the bearish pressure
The US Dollar Index trades slightly below the 20-day Simple Moving Average (SMA), currently located at 102.00. In case the DXY closes the day above that level, it could target 103.00 (static level, psychological level) and 103.40 (50-day SMA, 100-day SMA).
Meanwhile, the Relative Strength Index (RSI) indicator on the daily chart moves sideways slightly below 50, suggesting that buyers remain reluctant to bet on a steady recovery in the DXY.
On the downside, 101.50 (static level) align as interim support ahead of 101.00/100.80 (psychological level, static level, multi-month low set on April 14). A daily close below that support area could open the door for an extended slide toward 100.00 (psychological level).
What is US Dollar Index (DXY)?
The US Dollar Index, also known as DXY or USDX, is a benchmark index that was established by the US Federal Reserve in 1973. DXY is widely used as a tool measuring the US Dollar (USD) value in global markets. The index is calculated by measuring the US Dollar’s performance against a basket of six foreign currencies, the Euro, the Japanese Yen (JPY), Swedish Krona (SEK), the British Pound (GBP), the Swiss Franc (CHF) and the Canadian Dollar (CAD).
With 57.6%, the Euro has the biggest weight in the index followed by the JPY (13.6%), GBP (11.9%), CAD (9.1%), SEK (4.2%), and CHF (3.6%). Hence, a sharp decline in the EUR/USD pair could help the US Dollar Index rise even if the US Dollar weakens against some of the other currencies in the basket.
Author

Eren Sengezer
FXStreet
As an economist at heart, Eren Sengezer specializes in the assessment of the short-term and long-term impacts of macroeconomic data, central bank policies and political developments on financial assets.


