|

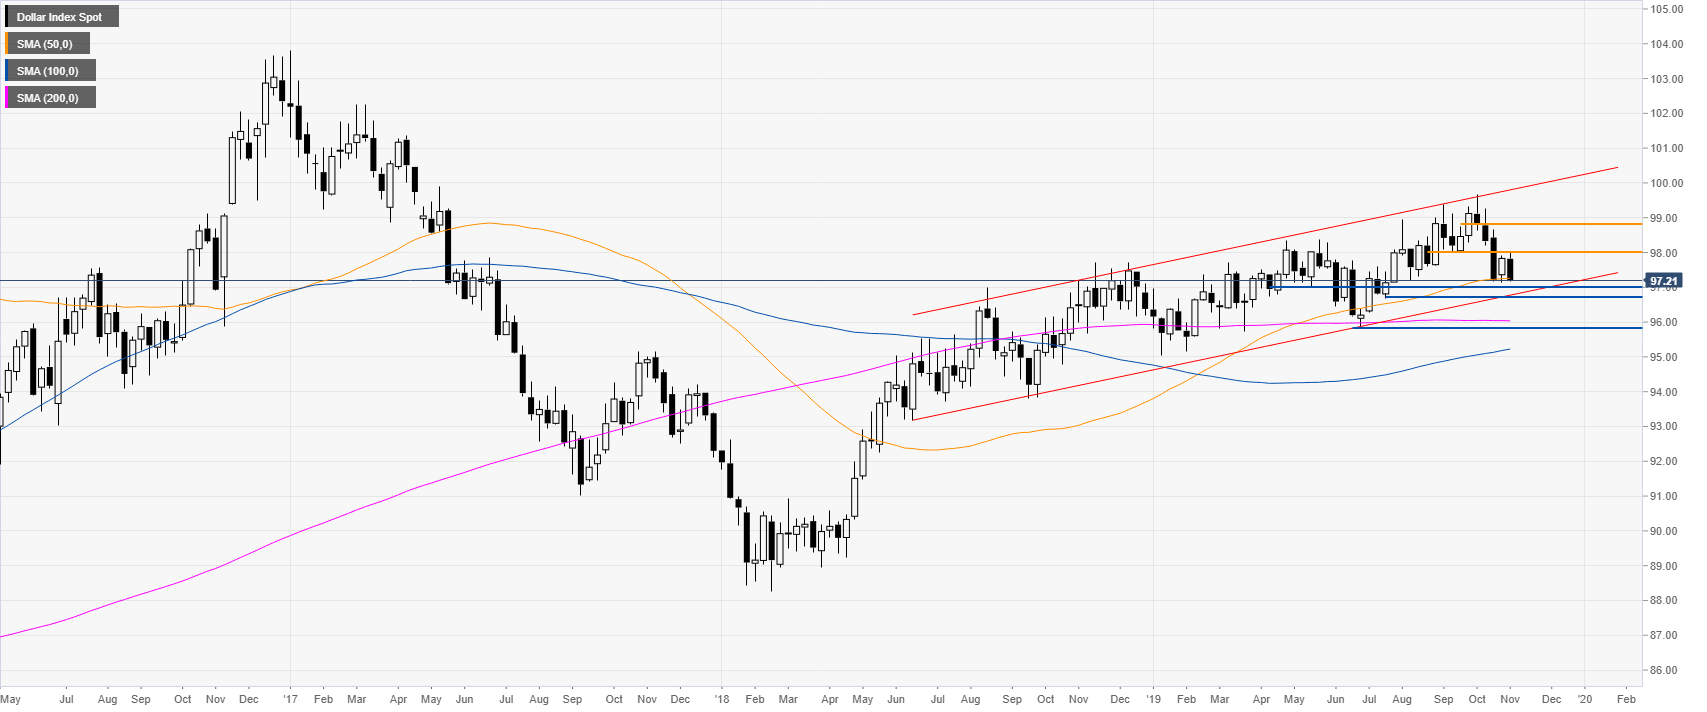
US Dollar Index technical analysis: DXY on life support, ends the week on its lows

  • The US Dollar Index (DXY) remains under heavy bearish pressure as this past month of October was the worst for DXY in 21 months. 
  • However, the bullish bias should remain in place while above the 97.00/97.60 support zone.


DXY weekly chart


The Index is ending near 97.16 and the 50 SMA on the weekly chart. DXY is trading in a bull channel and the market is trading in the lower range of the channel. There is strong support at the 97.00/96.70 support zone. However, if this level doesn’t hold DXY may drop to the 95.84 swing low, putting the bull trend at risk.
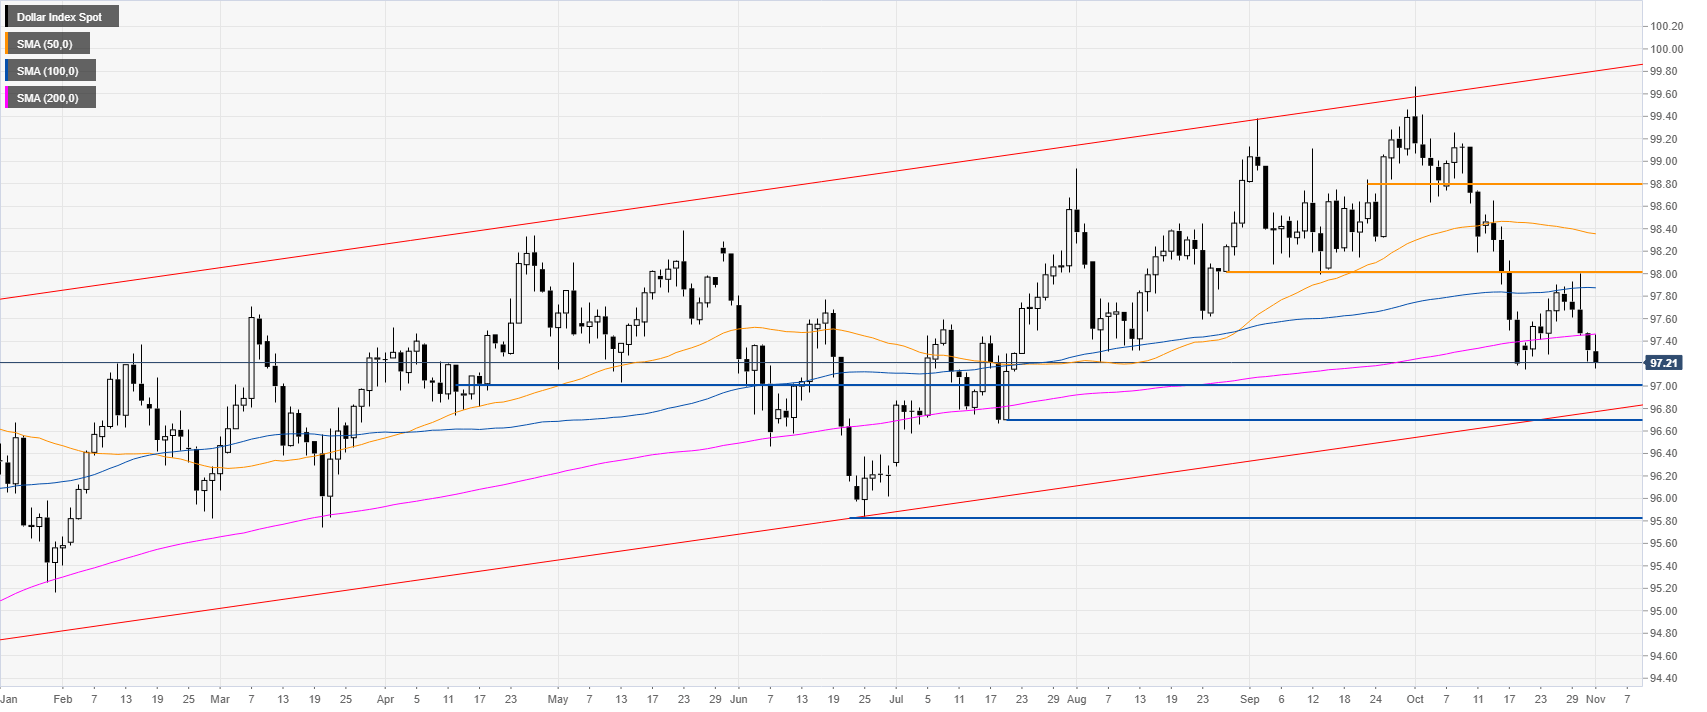
 

DXY daily chart

 
On the daily chart, the market is trading below its main SMAs, suggesting weakness. A drop to 97.00/96.70 seems likely given the lack of bullish commitment.
 
Next week, if buyers decide to come back, their first objective will be to break above the 98.00 handle followed by the 98.80 level. 
 

Additional key levels

Dollar Index Spot

Overview
Today last price97.21
Today Daily Change-0.11
Today Daily Change %-0.11
Today daily open97.32
 
Trends
Daily SMA2098.04
Daily SMA5098.36
Daily SMA10097.88
Daily SMA20097.46
 
Levels
Previous Daily High97.48
Previous Daily Low97.22
Previous Weekly High97.9
Previous Weekly Low97.15
Previous Monthly High99.67
Previous Monthly Low97.15
Daily Fibonacci 38.2%97.32
Daily Fibonacci 61.8%97.38
Daily Pivot Point S197.2
Daily Pivot Point S297.08
Daily Pivot Point S396.94
Daily Pivot Point R197.46
Daily Pivot Point R297.6
Daily Pivot Point R397.72

Author

Flavio Tosti

Flavio Tosti

Independent Analyst


More from Flavio Tosti
Share:

Editor's Picks

EUR/USD tests nine-day EMA support near 1.1850

EUR/USD inches lower during the Asian hours on Monday, trading around 1.1870 at the time of writing. The 14-day Relative Strength Index momentum indicator at 56 stays above the midline, confirming improving momentum. RSI has cooled from prior overbought readings but stabilizes above 50, suggesting dips could stay limited before buyers reassert control.

GBP/USD flat lines as traders await key UK macro data and FOMC minutes

The GBP/USD pair kicks off a new week on a subdued note and oscillates in a narrow range, just below mid-1.3600s, during the Asian session. Moreover, the mixed fundamental backdrop warrants some caution for aggressive traders as the market focus now shifts to this week's important releases from the UK and the US.

Gold buyers hesitate amid holiday-thinned trading

Gold trades volatile, but within range, as US, China holidays-led thin trading exaggerates moves. The US Dollar extends range play into the US GDP week, with markets pricing at least two Fed rate cuts this year. Technically, Gold tests key support at $5,000; daily RSI still remains bullish.

Top Crypto Losers: Dogecoin, Zcash, Bonk – Meme and Privacy coins under pressure

Meme coins such as Dogecoin and Bonk, alongside the privacy coin Zcash (ZEC), are leading the broader market losses over the last 24 hours. DOGE, ZEC, and BONK ended their three consecutive days of recovery with a sudden decline on Sunday, as crucial resistance levels capped the gains. Technically, the altcoins show downside risk, starting the week under pressure.

Global inflation watch: Signs of cooling services inflation

Realized inflation landed close to expectations in January, as negative base effects weighed on the annual rates. Remaining sticky inflation is largely explained by services, while tariff-driven goods inflation remains limited even in the US.

Ripple Price Forecast: XRP potential bottom could be in sight

Ripple edges up above the intraday low of $1.35 at the time of writing on Friday amid mixed price actions across the crypto market. The remittance token failed to hold support at $1.40 the previous day, reflecting risk-off sentiment amid a decline in retail and institutional sentiment.