US Dollar Index reached a two-year-high at 101.331 on Fed policymakers comments
- The US Dollar Index (DXY), hits a fresh 25-month high on Fed official’s comments.
- Fed speakers in the week support 50-bps rate hikes at the May 4-5 meeting.
- US Dollar Index Price Forecast (DXY): Bulls target January’s 2017 highs near 103.82.

The US Dollar Index, a measurement of the greenback’s value against a basket of six currencies, finished the week on a higher note, gaining 0.62%, and ended at 101.118, though short of the 2-year high reached on Friday’s session at 101.331.
Factors like Fed speaking throughout the week increased the appetite for the buck. Additionally, rising US Treasury yields underpinned the greenback, as the 10-year US Treasury yield, the benchmark note, finished at 2.903%, in the week won 2.69%.
Summary of Fed speaking
On Thursday, Fed Chair Jerome Powell blessed a half-point interest rate increase by the May 4-5 meeting. Meanwhile, money market futures have fully priced in a 0.50% hike to the Federal Fund Rate, which would lift it to 1%.
Later on Friday and the last Fed speaker before the May meeting blackout, Cleveland’s Fed President Loretta Mester commented that she would like to get neutral to 2.5% by the end of the year. When asked about 75-bps increases, Mester added that “we don’t need to go there at this point.” Furthermore, she supported a 50-bps increase in May and a few more after.
Elsewhere, St. Louis Fed President James Bullard admitted that the Fed is behind the curve but not as everybody thinks, while adding that the Fed has hiked 75 bps before without the world coming to an end.
San Francisco Fed President Mary Daly noted that the Fed “will likely” raise rates by 50 bps at a couple of meetings. However, according to Yahoo Finance Interview, she is open to deliberating what size of increases are needed. Daly reiterated that the Fed needs to take a measured pace on rate hikes and get rates up to 2.5% by the end of the year.
The week ahead in the US docket
The economic calendar for the US would feature March’s Durable Goods Orders, the US Gross Domestic Product for the Q1, and the Core Personal Consumption Expenditure (PCE) for March on annual and monthly readings, alongside the Chicago PMI.
Analysts at ING expect Q1 data to show the US economy expanded at a 1-1.5% annualized rate, which would be below Q4 of 2021 at 6.9%, reflecting the Omicron wave of the pandemic that impacted mobility considerably.
“However, recent data has pointed to a renewed uptick in activity and we expect to see stronger GDP growth for the second quarter. Durable goods orders should also be healthy based on regional manufacturing data, the ISM report, and higher Boeing aircraft orders. That said, we anticipate a bit more weakness in the housing data as surging mortgage rates take some of the steam out of the housing market.”
US Dollar Index Price Forecast (DXY): Technical outlook
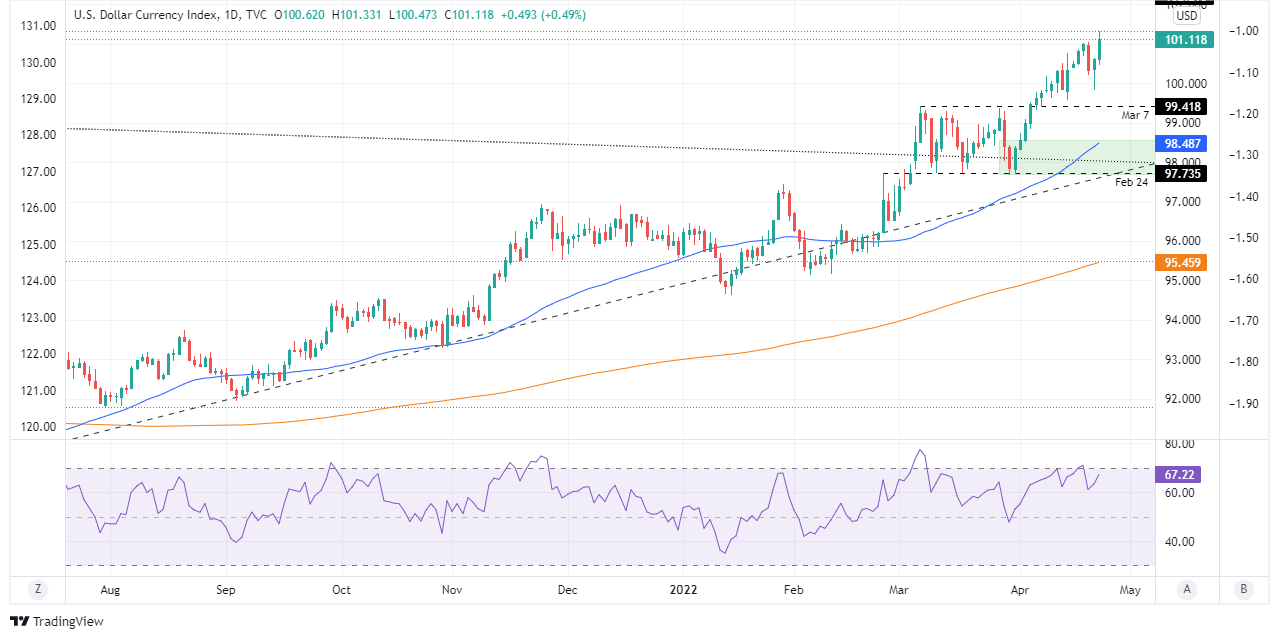
The US Dollar Index (DXY) retains its upward bias, as depicted by the daily chart. The 50 and the 200-day moving averages (DMAs) at 98.487 and 95.459, respectively, are well located under the DXY value, further cementing the upside bias. The Relative Strength Index (RSI) at 67.22 has enough room to spare if the DXY prints another leg up, near January’s 2017 highs around 103.82, before reaching overbought conditions. However, first, it would need to overcome some hurdles on its way north.
The DXY first resistance would be 102.00. A break above would expose March’s 24 daily high at 102.21, followed by March’s 20 2020 daily high at 102.99 and then the aforementioned 103.82 swing high.
Author

Christian Borjon Valencia
FXStreet
Markets analyst, news editor, and trading instructor with over 14 years of experience across FX, commodities, US equity indices, and global macro markets.


