|

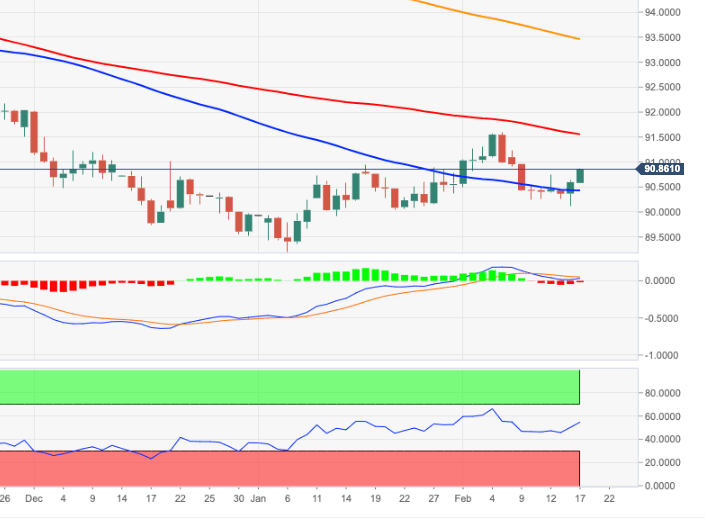
US Dollar Index Price Analysis: Sell the rallies into 91.00?

  • DXY adds to the recent upside and approaches 91.00.
  • The next significant hurdle is located around 91.60.

After testing the 2020-2021 support line in the 90.30/40 area, DXY embarked on an upside move that now trades at shouting distance from the key barrier near the 91.00 yardstick.

If the upside impulse picks up pace the next target of note comes in at the so far 2021 highs around 91.60 (February 5). This area of resistance is reinforced by the proximity of the 100-day SMA (91.56).

However, occasional bouts of upside pressure in the index are deemed as corrective only amidst the broader bearish view on the dollar. That said, bullish attempts to the 91.00 hurdle and beyond could represent selling opportunities against the current backdrop.

In the longer run, as long as DXY trades below the 200-day SMA (93.45), the negative stance is expected to persist.

DXY daily chart

Dollar Index Spot

Overview
Today last price90.85
Today Daily Change25
Today Daily Change %0.28
Today daily open90.6
 
Trends
Daily SMA2090.62
Daily SMA5090.39
Daily SMA10091.59
Daily SMA20093.51
 
Levels
Previous Daily High90.64
Previous Daily Low90.12
Previous Weekly High91.23
Previous Weekly Low90.25
Previous Monthly High90.95
Previous Monthly Low89.21
Daily Fibonacci 38.2%90.44
Daily Fibonacci 61.8%90.32
Daily Pivot Point S190.27
Daily Pivot Point S289.94
Daily Pivot Point S389.75
Daily Pivot Point R190.78
Daily Pivot Point R290.97
Daily Pivot Point R391.29

Author

Pablo Piovano

Born and bred in Argentina, Pablo has been carrying on with his passion for FX markets and trading since his first college years.

More from Pablo Piovano
Share:

Editor's Picks

AUD/USD falls to near 0.7100 after slipping below 50-day EMA

AUD/USD depreciates after registering minor gains in the previous day, trading around 0.7120 during the Asian hours. The technical analysis of the daily chart shows the pair consolidating sideways within a rectangle pattern, as neither bulls nor bears gain control. The AUD/USD pair is holding a slight bearish tone however as it sits beneath both the nine-day and 50-day EMAs.

160.00: USD/JPY back near intervention territory after upbeat US jobs report

US Nonfarm Payrolls beat expectations by a wide margin in May, with 172K jobs added. The US Dollar rebounds after the release, helping USD/JPY recover from its intraday lows. Warnings from Japanese authorities continue to limit upside potential near the 160.00 threshold.

Gold targets $4,300 amid stronger Dollar

Gold faces increasing selling interest and navigates the area of three-month lows near the $4,300 mark per troy ounce on Friday. The precious metal’s decline comes as traders assess the stronger-than-expected NFP, while the bid bias in the Greenback and higher US Treasury yields also collaborate with the retracement.

Cardano hits five-year low even as Hoskinson clarifies "break" isn't an exit

Cardano (ADA) price is down 10% at press time on Friday, extending losses over 30% so far this week amid Charles Hoskinson's clarification that "break" isn't an exit.

Week ahead – Fed countdown begins amid US inflation data and geopolitical risks

Fed Chair Warsh’s first meeting approaches as key US inflation data could reshape expectations. Oil prices remain elevated as US-Iran talks continue; tariffs also return to the spotlight. ECB is expected to hike; will it be a one-off move or is July live?

The US economy defies the rules: 100 days into the Oil shock and the recession signal is still missing

More than three months after the start of the Iran war and the resulting disruption to global energy markets, the US economy continues to display remarkable resilience. The conflict has triggered a sharp rise in Oil prices, reignited inflationary pressures and fueled widespread concerns about a potential economic slowdown.