US Dollar Index Price Analysis: DXY eyes further downside past 96.00 inside nearby trading range
- DXY refreshes intraday low while reversing Monday’s gains.
- Bearish MACD signals, failures to stay beyond 96.00 keep sellers hopeful.
- 61.8% Fibonacci retracement level, two-month-old support line restricts short-term downside.
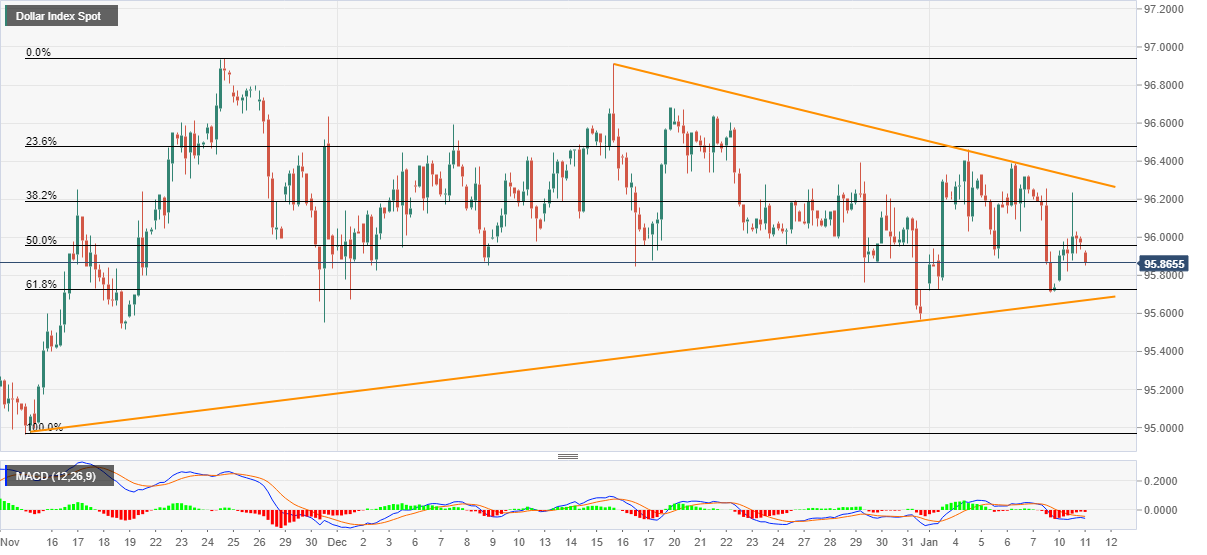
US Dollar Index (DXY) takes offers around 95.85, down 0.10% intraday during early Tuesday morning in Europe.
In doing so, the greenback gauge stays within a 70-pip trading range between an ascending support line from mid-November and a monthly resistance, respectively around 95.65 and 96.30.
Given the quote’s latest declines below the 50% Fibonacci retracement (Fibo.) level of November 15-24 upside, coupled with the bearish MACD signals, DXY prices are likely to witness further losses.
However, 61.8% Fibo. and the aforementioned support line, close to 95.70 and 95.65 in that order, challenges the gauge’s short-term downside.
Should the US Dollar Index (DXY) stay below 95.65, bears can eye for 95.50 and 95.00 supports.
Meanwhile, recovery moves may initially battle 50% and 38.2% Fibonacci retracement levels, around 95.18 and 96.20 respectively.
It’s worth noting that the DXY bulls remain cautious until the quote rises past 96.30, a break of which will recall the 96.70 and the 97.00 round figure on the chart.
DXY: Four-hour chart
Trend: Further declines expected
Author

Anil Panchal
FXStreet
Anil Panchal has nearly 15 years of experience in tracking financial markets. With a keen interest in macroeconomics, Anil aptly tracks global news/updates and stays well-informed about the global financial moves and their implications.


