US Dollar Index extends decline into 102.70, sets a three-month low
- The US Dollar Index (DXY) declined to its lowest bids in over three months on Tuesday.
- The DXY fell nearly half a percent heading into Wednesday.
- Dovish Fed talk sparked a risk bid that pushed the US Dollar down across the board.

The US Dollar Index (DXY) shed half a percent on Tuesday following a broad-market recovery in risk appetite as investors hit the bids, sending the US Dollar (USD) down against all of its major FX currency peers.
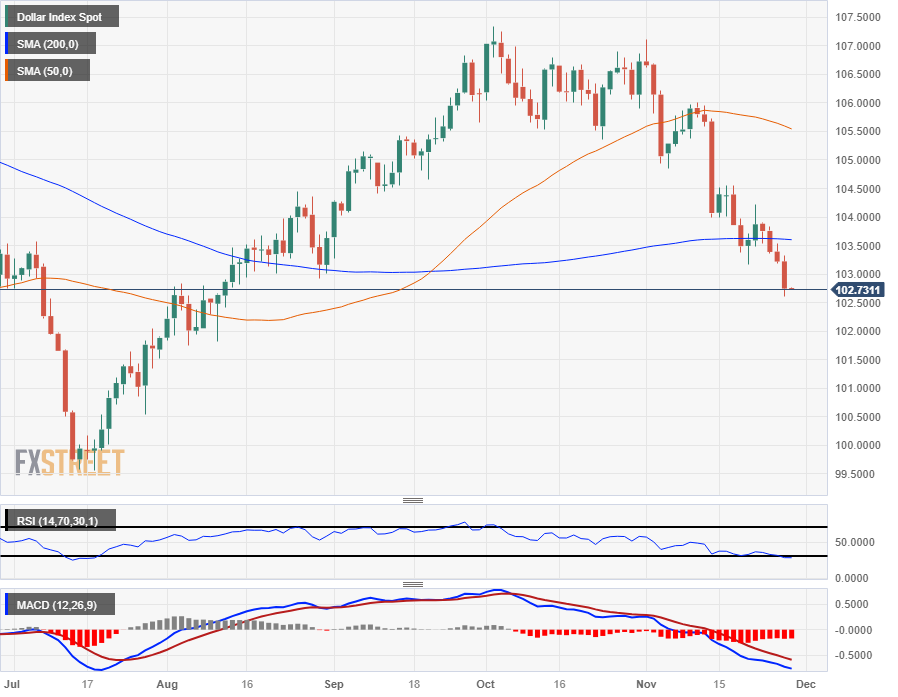
The DXY extended into a three-month low past 102.70 and is down six-tenths of a percent on the week heading into the Wednesday market session.
Fed's Waller sparks Dollar decline
The US Dollar saw firm selling pressure after Federal Reserve Governor Christopher Waller commented on interest rates while speaking with Michael Strain, the Director of Economic Policy Studies, at the American Enterprise Institute.
Fed Governor Waller noted that if inflation continues to decline towards the Fed's targets, he sees no reason to keep interest rates elevated going forward.
The dovish sentiment, lacking particulars, was enough to kick off a fresh risk bid across the markets, sending equities, Gold markets, and risk asset classes higher as the DXY sold off.
Next Up: US GDP, PCE prices
Wednesday markets will be turning towards the US' latest quarterly Gross Domestic Product (GDP) growth, with median market forecasts calling for a QoQ uptick from 4.9% to an even 5.0%, while Personal Consumption Expenditure (PCE) Prices for the third quarter will also be seeing a preliminary print.
With inflation the market's hot-button topic of choice as Fed watchers loom, US PCE could see an outsized impact if prices or GDP growth surprise to the upside. QoQ PCE Prices last printed at 2.9% for the second quarter, and will provide a preview for Friday's Core PCE Price Index reading for October.
Markets are currently hoping that MoM Core PCE Index figures will decline from 0.3% to 0.2%. An upside disappointment to the figure could see the DXY rally as inflation-fearing market participants tumble back into safe haven bets on the US Dollar.
US Dollar price today
The table below shows the percentage change of US Dollar (USD) against listed major currencies today. US Dollar was the weakest against the Japanese Yen.
| USD | EUR | GBP | CAD | AUD | JPY | NZD | CHF | |
| USD | -0.35% | -0.47% | -0.29% | -0.58% | -0.69% | -0.54% | -0.28% | |
| EUR | 0.34% | -0.12% | 0.06% | -0.23% | -0.33% | -0.21% | 0.07% | |
| GBP | 0.48% | 0.13% | 0.21% | -0.09% | -0.19% | -0.07% | 0.19% | |
| CAD | 0.28% | -0.07% | -0.19% | -0.30% | -0.40% | -0.26% | -0.01% | |
| AUD | 0.58% | 0.22% | 0.11% | 0.29% | -0.10% | 0.04% | 0.32% | |
| JPY | 0.67% | 0.33% | 0.21% | 0.41% | 0.10% | 0.13% | 0.41% | |
| NZD | 0.54% | 0.20% | 0.07% | 0.26% | -0.04% | -0.14% | 0.27% | |
| CHF | 0.27% | -0.08% | -0.21% | 0.00% | -0.31% | -0.42% | -0.26% |
The heat map shows percentage changes of major currencies against each other. The base currency is picked from the left column, while the quote currency is picked from the top row. For example, if you pick the Euro from the left column and move along the horizontal line to the Japanese Yen, the percentage change displayed in the box will represent EUR (base)/JPY (quote).
Dollar Index Technical Outlook
The US Dollar flattened across the board on Tuesday, declining against all of its major currency pairings.
The USD declined the most against its Pacific market peers, shedding almost seven-tenths of a percent against the Japanese Yen (JPY), nearly 0.6% against the Aussie (AUD), and just under six-tenths of a percent against the Kiwi (NZD).
Tuesday's half-percent backslide in the DXY takes the Dollar Index further south of the 200-day Simple Moving Average (SMA), and there is little in the way of near-term technical support for the DXY until mid-July's swing lows below the major 100.00 handle.
Dollar Index Daily Chart
Dollar Index Technical Levels
Author

Joshua Gibson
FXStreet
Joshua joins the FXStreet team as an Economics and Finance double major from Vancouver Island University with twelve years' experience as an independent trader focusing on technical analysis.
















