Unity Software (U) plunges toward triple-layer support structure

Unity Software (U) closed Friday at $29.10 after experiencing one of the most brutal declines I've seen in the gaming engine space. From highs above $50 just weeks ago, U has shed nearly half its value in a relentless downtrend that shows little sign of exhaustion. For a company that powers some of the world's most popular video games and interactive 3D content, this kind of technical destruction raises serious questions about where the bleeding stops.
The good news? There's a clearly defined support structure below that could provide relief if—and this is a big if—buyers decide to step in.
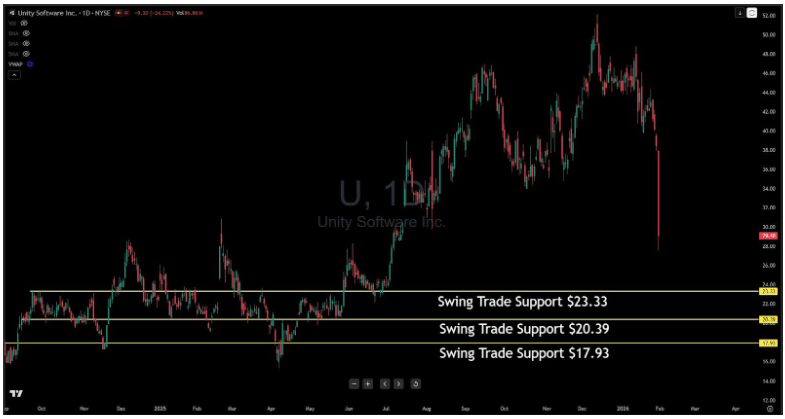
I've identified three swing trade support levels that represent historically significant price zones where U has previously found its footing. The first line in the sand sits at $23.33, roughly $6 below Friday's close. This level coincides with prior consolidation areas where the stock paused during previous moves. It's the nearest potential floor, but given the velocity of this decline, there's no guarantee it holds on first contact.
If $23.33 fails to contain the selling pressure, the next target drops to $20.39. This represents a deeper retracement and would mark roughly a 60% decline from recent highs—a sobering number, but not unprecedented for high-growth tech names that fall out of favor. Think of this as the secondary defense line where longer-term value investors might start circling.
The deepest support level I'm watching sits at $17.93. This zone represents a multi-year low area and would constitute a complete unwinding of the post-pandemic rally structure. A move to this level would require either catastrophic fundamental news or a broader market selloff that drags everything down indiscriminately.
What makes this setup particularly useful for swing traders is the spacing between these levels. Each support zone is separated by roughly $3, giving you clear demarcation points to structure trades around. If you're looking to catch a bounce, waiting for price to reach one of these levels, and then confirming with bullish price action, offers far better risk-reward than trying to catch falling knives at current levels.
For bearish traders, each support level represents a logical profit-taking zone. The spacing also allows for scaling out of short positions as price descends through the structure.
The risk, of course, is that U doesn't respect any of these levels and continues its freefall. Any close below $17.93 would invalidate this support thesis entirely and suggest the stock needs to find a new equilibrium much lower. For now, these three levels provide the roadmap. The market will reveal which one—if any—finally brings buyers back to the table.
Author

Benjamin Pool
Verified Investing
A seasoned financial expert with a passion for empowering individuals to mastering smart money management.


