United Health Group Inc.(UNH) Elliott Wave technical analysis [Video]
![United Health Group Inc.(UNH) Elliott Wave technical analysis [Video]](https://editorial.fxstreet.com/images/Markets/Equities/Industries/DiversifiedFinancials/calculating-637322940397936981_XtraLarge.jpg)
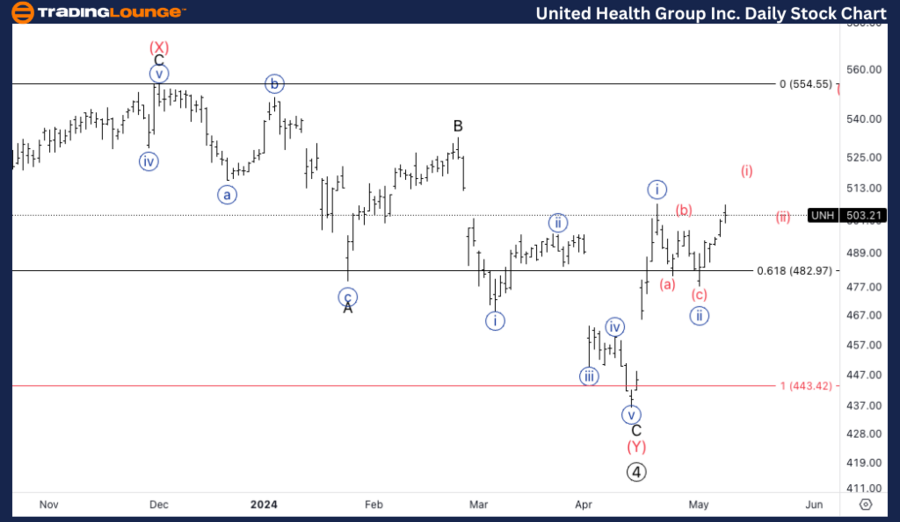
UNH Elliott Wave Analysis Trading Lounge Daily Chart,
United Health Group Inc., (UNH) Daily Chart
UNH Elliott Wave technical analysis
Function: Trend.
Mode: Impulsive.
Structure: Motive.
Position: Minute wave {iii}.
Direction: Upside in Minute {ii}.
Details: As we seem to have found support on TL5 at 500$, we are looking for upside resumption, which could take us to TL8 in the long term.
The Elliott Wave analysis for UnitedHealth Group Inc. (UNH) provides a technical forecast for its stock behavior on the Daily and 4-hour charts. This detailed analysis aims to guide traders and investors through the expected price movements influenced by UNH’s wave patterns.
UNH Elliott Wave technical analysis – Daily chart
On the daily chart, UNH is currently in a Minute wave {iii} of its impulsive, motive wave structure, signaling robust upward potential. The stock found support at the $500 mark, along the critical TL5 (Trend Line 5). This support suggests a bullish resumption might be forthcoming, with the potential to reach higher trend line levels like TL8 over the long term.
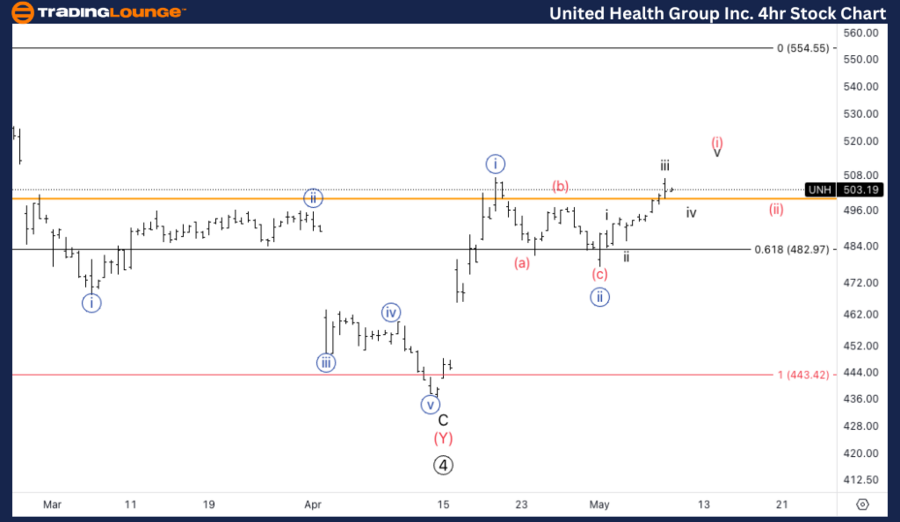
UNH Elliott Wave Analysis Trading Lounge 4Hr Chart.
United Health Group Inc., (UNH) 4Hr Chart.
UNH Elliott Wave technical analysis
Function: Trend.
Mode: Impulsive.
Structure: Motive.
Position: Wave (i) of {iii}.
Direction: Wave iii of (i).
Details: Looking for a completion of wave (i) to then pullback in (ii) and eventually looking for additional longs.
UNH Elliott Wave technical analysis – Four-hour chart
Drilling down to the 4-hour chart, UNH is advancing through Wave (i) of Minute {iii}. The current structure indicates that Wave (i) is nearing completion, and a subsequent pullback in Wave (ii) is expected. This pullback should set the stage for further bullish activity as the stock progresses into Wave iii of (i).
Technical analyst: Alessio Barretta.
UNH Elliott Wave technical analysis [Video]
Author

Peter Mathers
TradingLounge
Peter Mathers started actively trading in 1982. He began his career at Hoei and Shoin, a Japanese futures trading company.


