Three energy stocks nearing breakouts from cup-shaped patterns

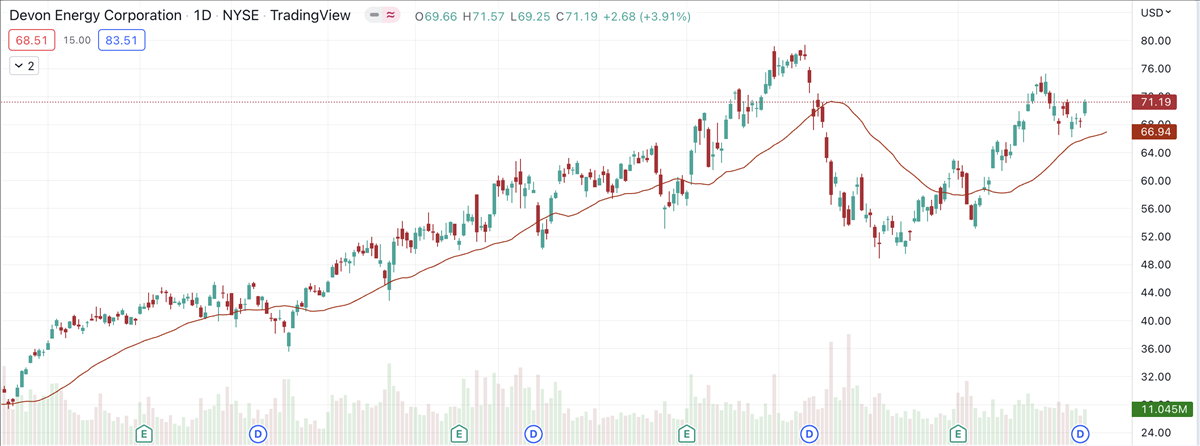
S&P 500 component Devon Energy (NYSE: DVN) is among the market’s best performers, outrunning its index by a wide margin.
Energy continues to be a sector that’s home to stocks living up to the name, while others continue to languish.
Year-to-date, Devon has advanced 64.20%, boosted more recently by a small uptrend in August, just as the broader market was declining. The stock is up 18.67% in the past month. Shares closed at $71.20 Monday, up $2.69 or 3.93%.
Meanwhile, the S&P 500 is down 14.79% year-to-date, although it rallied 3.66% the week ended September 8, and gapped 1.07% higher Monday.
Devon announced on August 9 that it entered into a definitive purchase agreement to acquire Validus Energy, which operated in the Eagle Ford Shale in Texas, in a cash transaction valued at $1.8 billion. It’s expected to close at the end of the third quarter.
Since Devon reported earnings on July 29, four analysts boosted their price targets on the stock, according to MarketBeat analyst ratings. Wall Street’s consensus rating on the stock is a “moderate buy” with a price target of $75.53, an upside of 6.08%.
The company has been on a tear, growing both sales and earnings at double- and triple-digit rates in each of the past four quarters. It has a stellar return on equity, at 39%.
Devon’s chart is revealing a classic cup-with-handle pattern, with a buy point above $75.27. It’s a toss-up whether those patterns actually work at any given time. However, it makes intuitive sense that institutional investors would snap up shares after a short selloff, giving them an opportunity to add to a position at a lower valuation.
Energy sector still powering up
The energy sector remains the big winner of 2022. The Energy Select Sector SPDR ETF (NYSEARCA: XLE) has returned 48.12% this year. The only other sector with a 2022 gain is utilities, which is up 8.10%.
The best performer within the large-cap energy sector is Occidental Petroleum (NYSE: OXY), which checks in with a gain of 126.32% this year. Like Devon, large-cap Occidental has been notching a string of solid earnings and revenue increases in recent quarters.
Smaller energy companies have also been participating in this year’s rally. For example, an ETF I often use as a proxy for the small-cap energy sector is the Invesco S&P Small Cap Energy ETF (NYSEARCA: PSCE). This ETF, which is based on the S&P SmallCap 600 Capped Energy Index, is up 44.17% this year.
Because the index tracks smaller companies, risks are higher but so is the potential reward. It’s been outperforming the broader market (by a long shot), which is exactly the ETF’s premise, during periods when energy prices are rising.
Watch the chart patterns
The largest component in the small-cap energy index, by weighting, is SM Energy (NYSE: SM), a Denver-based natural gas explorer and producer with a market cap of $5.669 billion. Although a small cap is traditionally a company with a market capitalization below $2 billion, it’s too hard for indexes to reconstitute when a company grows to the level where it’s technically a mid-cap, as SM is.
SM has returned 57.84% year-to-date. In Monday’s session, the stock cleared a cup-with-handle pattern, although it retreated to finish below the breakout price, but still with a gain on the session.
Interestingly, the broader large-cap S&P is following a trajectory similar to the numerous cup-and-handle patterns we’re seeing in energy stocks, but with less upside momentum in recent weeks. A weekly chart for the S&P 500 indicates that a handle could possibly form soon, if we see a downturn of five days or more.
Denbury (NYSE: DEN) is forming a cup-shaped pattern below its August 23 high of $93.95. The stock corrected after rallying on rumors of a sale, but there’s been no news on that front in recent weeks. Even without being an acquisition target, the Plano, Texas-based explorer and developer is showing strength relative to the broader market, and analysts expect strong earnings in the next two years.
It’s always a good idea to focus on stocks outperforming the broader market, but use caution: Don’t chase stocks well beyond their breakouts, but use MarketBeat data tools to find fundamentally strong stocks that are in the early stages of price upticks.
Author

Jacob Wolinsky
ValueWalk
Jacob Wolinsky is the founder of ValueWalk, a popular investment site. Prior to founding ValueWalk, Jacob worked as an equity analyst for value research firm and as a freelance writer. He lives in Passaic New Jersey with his wife and four children.


