This key signal just flashed in the S&P 500 [Video]
![This key signal just flashed in the S&P 500 [Video]](https://editorial.fxsstatic.com/images/i/Equity-Index_S&P500-1_XtraLarge.jpg)
Watch the video from the WLGC session on 18 Feb 2025 to find out the following:
-
Why the latest resistance break in the S&P 500 could signal a bullish shift.
-
The role of volatility contraction and what it means for future price action.
-
How to spot individual stocks with strong relative strength that can outperform the market.
-
and a lot more...
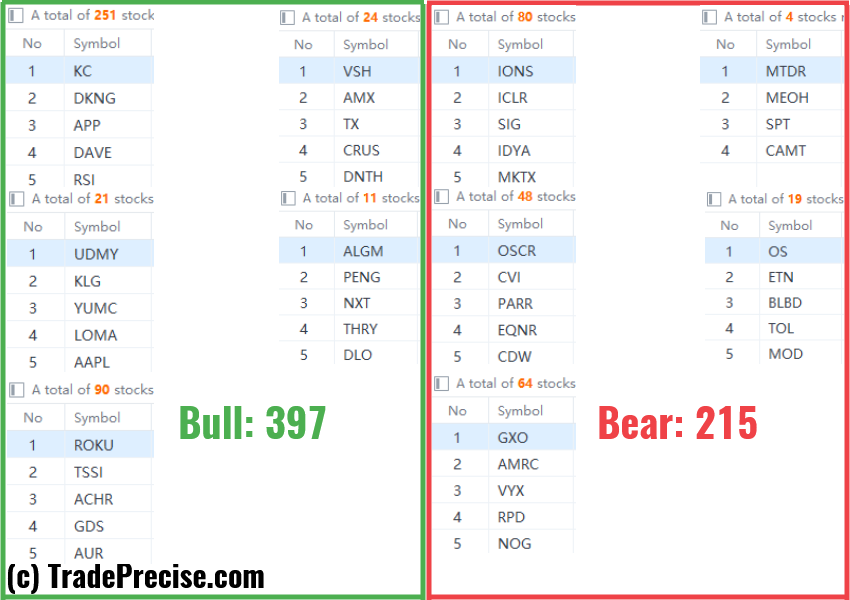
Market environment
The bullish vs. bearish setup is 397 to 215 from the screenshot of my stock screener below.
Three stocks ready to soar
21 actionable setups such as DAVE, TSSI, ASTS were discussed during the live session before the market open (BMO).
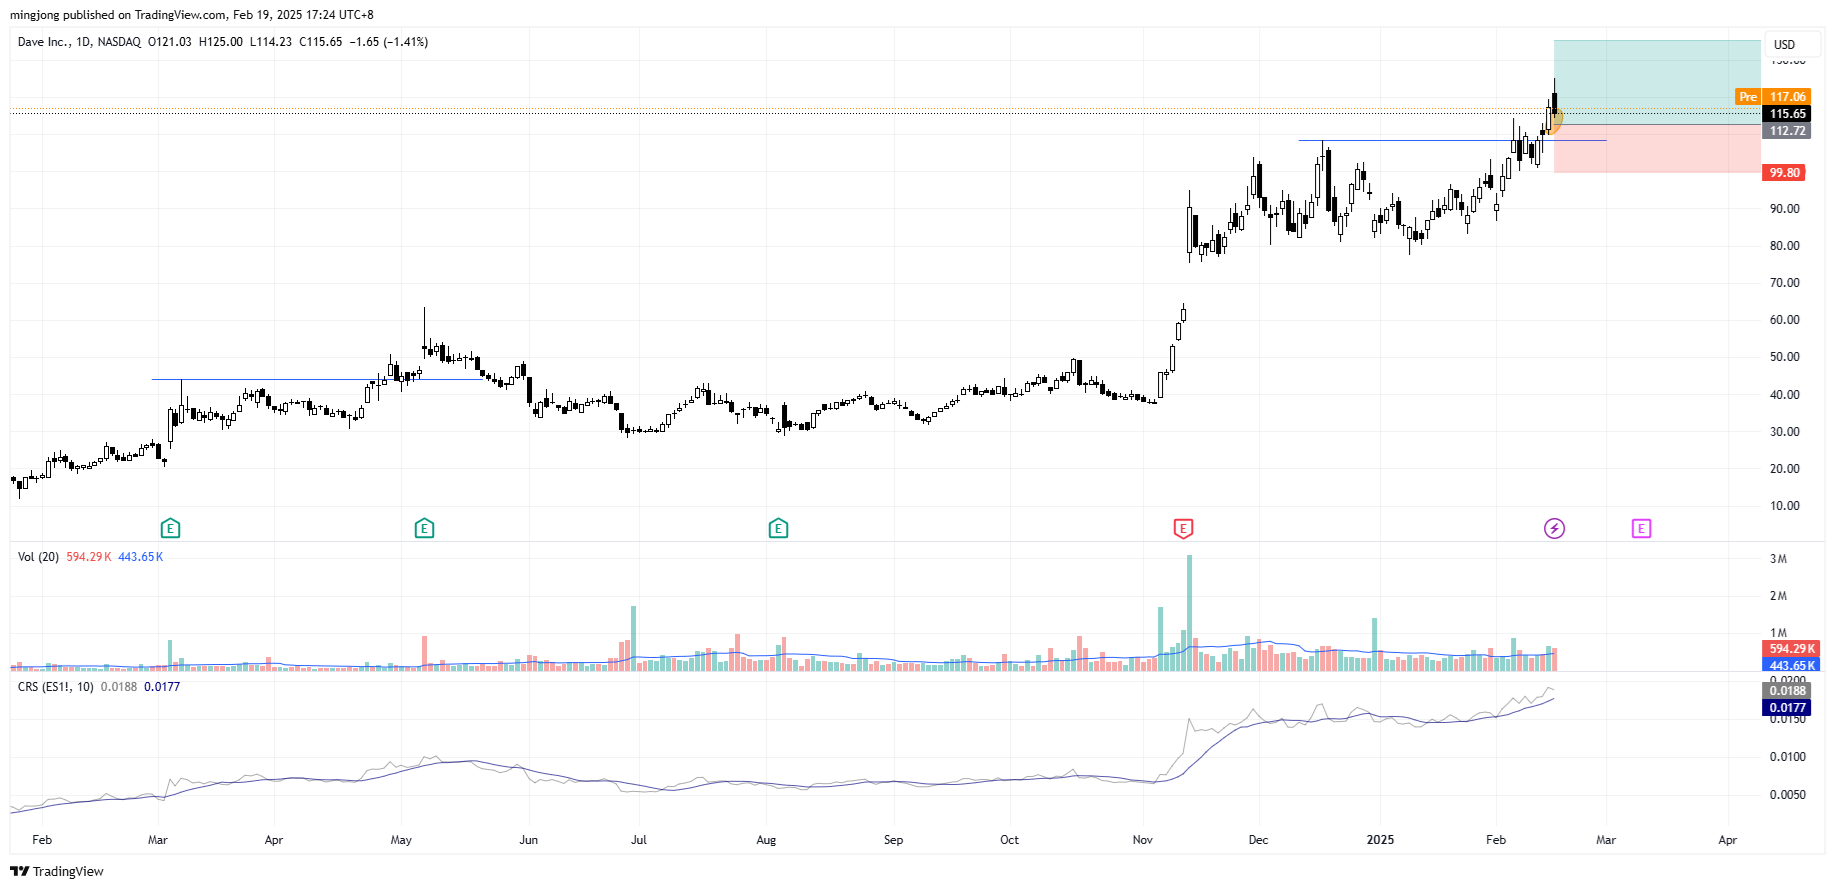
DAVE Inc (DAVE)
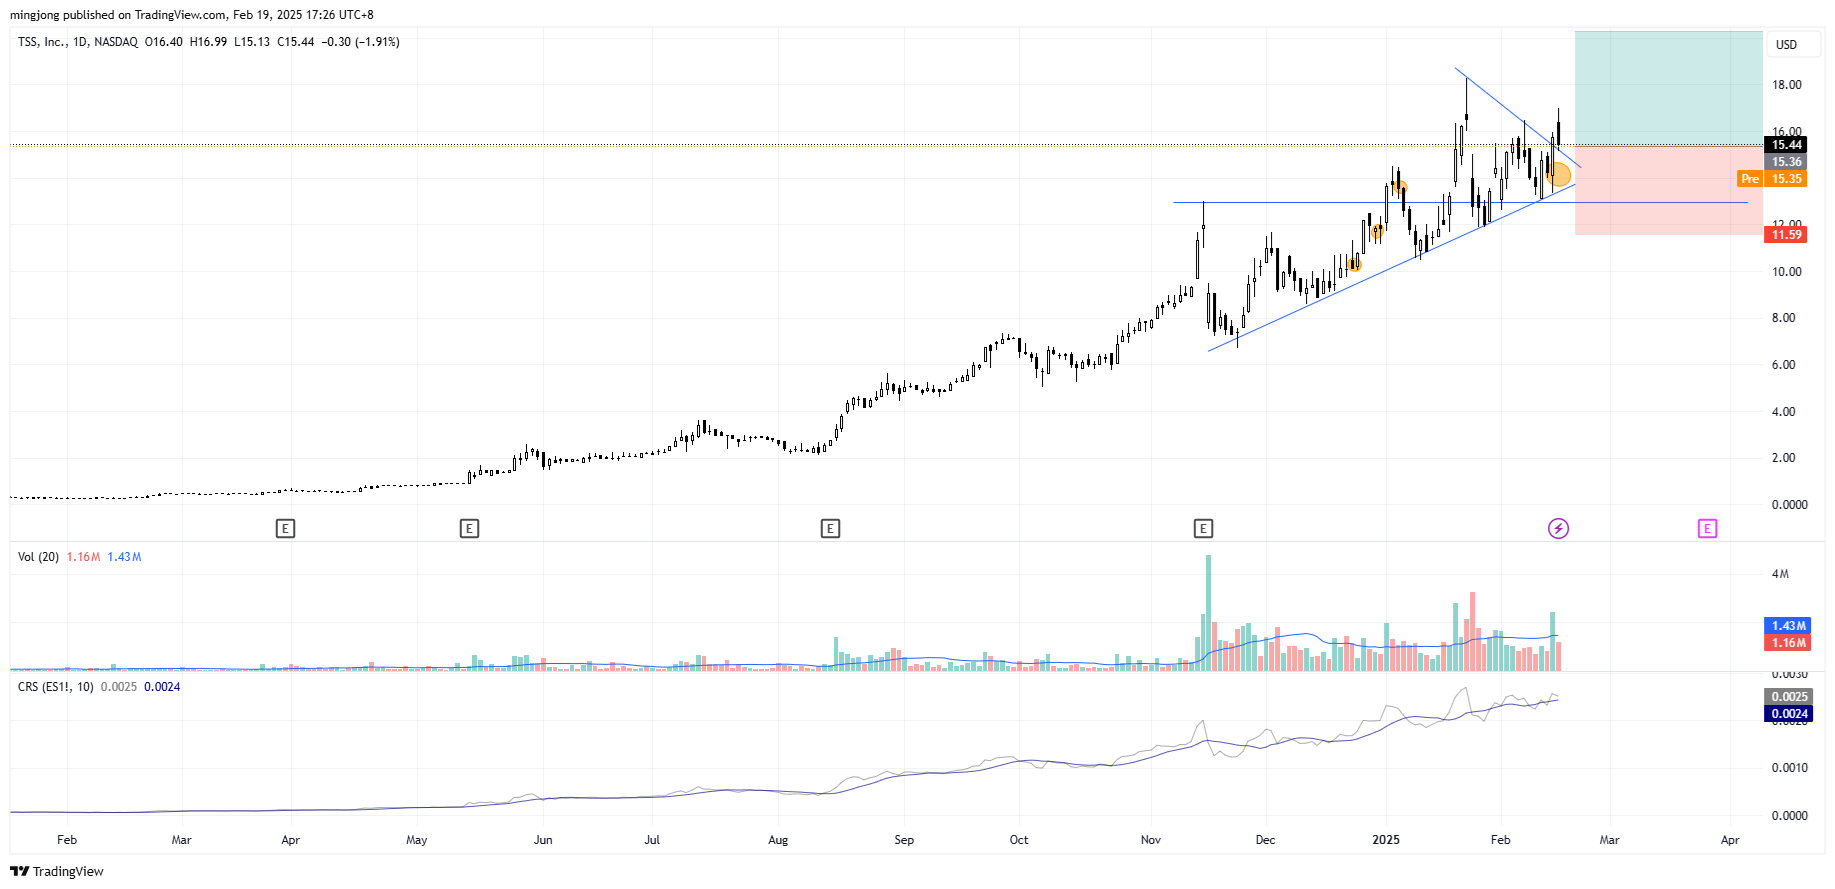
TSS Inc (TSSI)
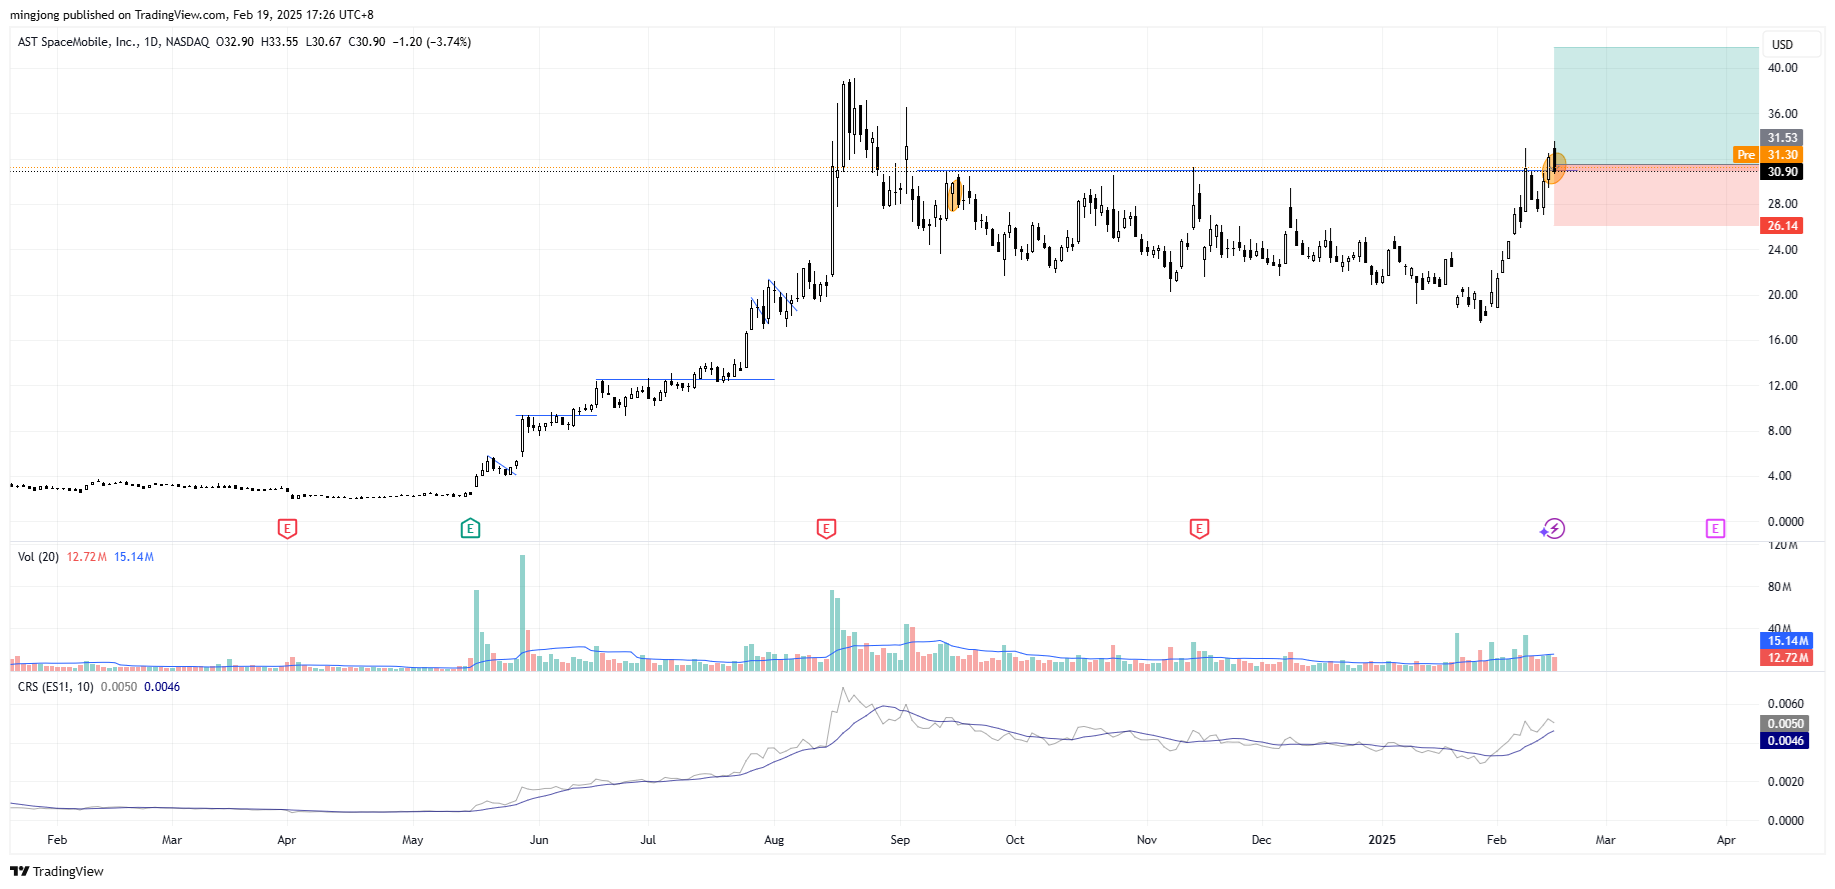
AST SpaceMobile (ASTS)
Author

Ming Jong Tey
Independent Analyst
Ming Jong Tey has been trading since 2008. He started his learning journey from technical analysis (indicators, Fibonacci, etc...) to value investing. Throughout his journey, he develops an interest in price action with chart pattern trading.


