The S&P 500 will see a countertrend rally soon

In our update from last week, we showed that the SP500 YTD responded quite well to mid-term election-year seasonality, therefore suggesting a low around March 13 and a high around March 20. We use “around” because these dates are approximately ±3 trading days.
Fast forward to today, the index hit its lowest point on March 13 at $6632 and reached a high on March 17 at 6754. As of today, March 20, the index is making new lows, trading at around $6500. Therefore, the March 13 low was accurate, while the March 17 high was within a +/-3 trading-day margin of error.
Table 1: YTD comparison between seasonality and actual market highs and lows
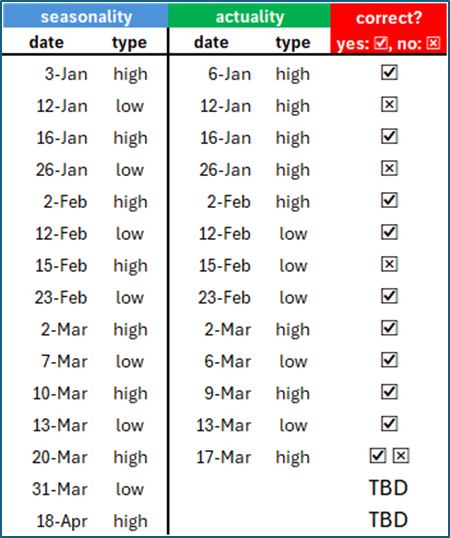
Therefore, it is somewhat difficult to determine whether the March 20 high was reached, so we give it a “yes-and-no” verdict. Yes, because it falls within the margin of error. No, because on the actual day, the index is below the March 13 low. However, overall, the index has topped and bottomed per mid-term election-year seasonality 9 out of 13 times, arguably 10 out of 13. That is a reliable scorecard.
Although, of course, past performance is no guarantee of future results, it does suggest we should continue to expect the market to follow this path going forward, but it appears the low around March 31 will be earlier. As illustrated using our Elliott Wave count in Figure 1 below, and because the March 20 top occurred on the 17th.
Figure 1. Intermediate-term Elliott wave count for the SPX since October 2025
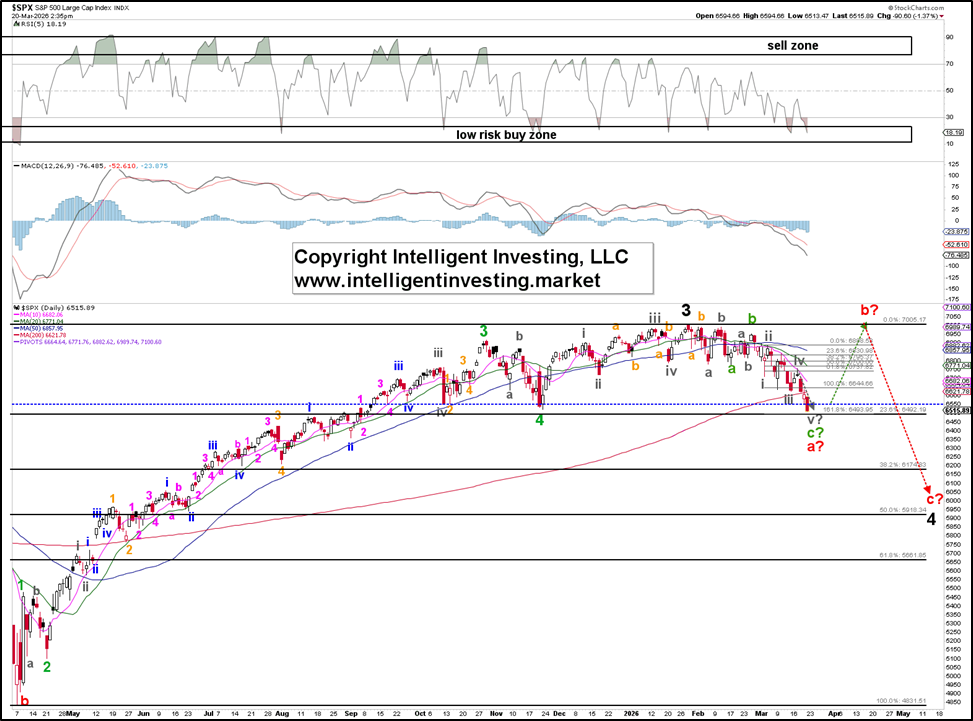
As always, we focus on what is most likely rather than what is just possible. The index is about to hit the (black) 0.236 retracement of the rally from the April low, around 6492. Also, that’s where the gray 1.618x extension of W-i is located: 6493. This is a common target for a 5th wave in an ending diagonal (ED), as we count the decline from the February 25th high (green W-b) as an ED (green) W-c.
Since we are experiencing a fourth wave correction similar in size to the 2022 decline—which was a second wave—and corrections involve at least three waves, shown here as a red W-a, b, and c, it’s unlikely that such a shallow retracement will constitute the entire correction. It's possible but unlikely. Additionally, as mentioned in previous updates, seasonality after the April 18 top suggests a decline into late September before the next rally begins.
Therefore, based on the available objective data, we can forecast that
· This diagonal should complete around $6490 ± 10 for the red W-a of the black W-4.
· A countertrend rally will start when the W-a completes, but it is only a B-wave, topping out at around $6900+/-100 on April 18.
· That should trigger another decline (red W-c) to at least the 0.382 retracement of the rally from the April low.
Since December, when we introduced this seasonality, the market has responded quite well. Therefore, moving forward, we must assume it will continue. However, we remain vigilant and will—just as always—monitor the price action to spot any deviations: anticipate, observe, and adjust if needed.
Author

Dr. Arnout Ter Schure
Intelligent Investing, LLC
After having worked for over ten years within the field of energy and the environment, Dr.


