Why the WTI sell-off may be hiding a supply warning
- WTI’s correction shows a decline from above $92 in late July to below $76.
- The futures curve does not confirm a fully bearish reset, but it does signal severe backwardation.
- US fundamentals remain mixed rather than weak.
- The base case is a volatile $77–$88 range, but a verified shipping normalisation would expose $68–$75, while renewed disruption could return prices to $92–$105.

Prices for the barrel of the American Oil benchmark have fallen sharply as hopes of a US-Iran agreement have resurfaced, but a deeply backwardated Oil curve, tight Cushing stocks and light speculative positioning all warn that the sell-off may have gone too far.
West Texas Intermediate (WTI) prices have retreated as Washington has paused further strikes, and negotiations over shipping security appear to have resumed. Yet, the physical and derivatives markets still show signs of scarcity, leaving WTI vulnerable to another violent reversal.
WTI’s retreat is a correction, not yet a return to normal
Prices of WTI have broken below the $76 mark per barrel on Tuesday, shedding nearly 20% since the late July ceiling above the $92 yardstick, all after prices repeatedly swung on reports of progress or setbacks in talks involving the US and Iran.
The sharp retracement reflects a lower geopolitical premium, but it is not proof that the underlying disruption has ended. Markets have repeatedly priced an imminent settlement before attacks or shipping restrictions returned.
Political statements remain a weak substitute for physical confirmation until tanker traffic, insurance conditions, and export volumes normalise for more than a few sessions.
The Oil curve is the strongest warning against chasing the sell-off
The WTI curve remained in steep backwardation in late July. The front contract stood at $85.27, compared with $82.25 for the second contract and $70.41 for the twelfth. The resulting M1–M2 spread was $3.02 per barrel, while M1–M12 reached nearly $15.
Backwardation of this scale means buyers were still willing to pay materially more for prompt delivery than for Oil one year ahead. Part of that premium is geopolitical, but the shape is inconsistent with a market expecting an immediate surplus. It also creates positive roll yield for long positions, potentially limiting the persistence of bearish momentum.
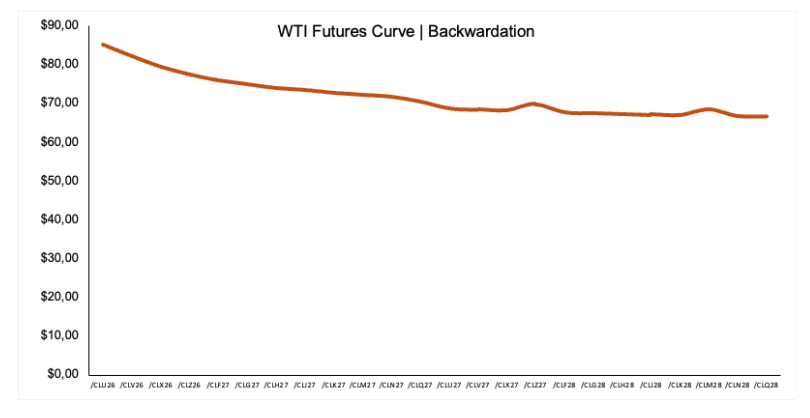
The curve, therefore, supports a two-speed forecast: the front of the market remains hostage to US-Iran headlines, while the deferred curve is already pencilling in a substantial eventual normalisation.
EIA data point to tight buffers, not an outright shortage
Commercial crude inventories rose by 2 million barrels to 411.7 million in the week to July 17, according to the latest EIA report, but remained 6% below the 5-year seasonal average. Crude Oil stocks at Cushing fell by 674K barrels to 19.4 million and were more than 10 million barrels below their 5-year comparison.
Product inventories also remained lean: Gasoline inventories were 7% below their 5-year average, and distillates were 10% below, despite weekly builds. Refinery utilisation held at a strong 96.1%, while total petroleum demand rebounded by just over 1 mbpd on the week.
This is not an unambiguously bullish balance: commercial crude, gasoline and distillate stocks all increased. Nevertheless, low absolute buffers, especially at Cushing, mean a fresh disruption could translate into prompt prices faster than it would in a well-supplied market.
Indicator | Latest | Unit | WoW | vs 5Y | Model bias |
Commercial crude stocks ex-SPR | 411.7 | million bbl | +2.010 | -22.321 | Bearish weekly / tight level |
Cushing crude stocks | 19.370 | million bbl | -0.674 | -10.138 | Bullish |
US crude production | 13.798 | million bpd | -0.063 | +1.383 | Bullish weekly / ample level |
Refinery crude inputs | 17.065 | million bpd | -0.058 | +0.720 | Bearish weekly / strong level |
Refinery utilisation | 96.1 | % | -0.100 | +3.340 | Strong runs |
Total petroleum supplied | 20.519 | million bpd | +1.042 | -0.517 | Bullish weekly / soft level |
US shale offers only a gradual supply response
US crude production slipped by 63K kbpd to 13.798 million in the week ending July 17. Baker Hughes counted 450 oil-directed rigs on July 24, down two on the week but still ten higher than four weeks earlier and 38 above the comparable 2025 level.
The message is nuanced: drilling activity is not collapsing, but neither does the latest weekly decline suggest an immediate shale surge that could neutralise a renewed Gulf shock. Furthermore, rig counts also affect output with a lag, making them a medium-term ceiling on prices rather than a near-term defence against disruption.
CFTC positioning leaves room for another violent move
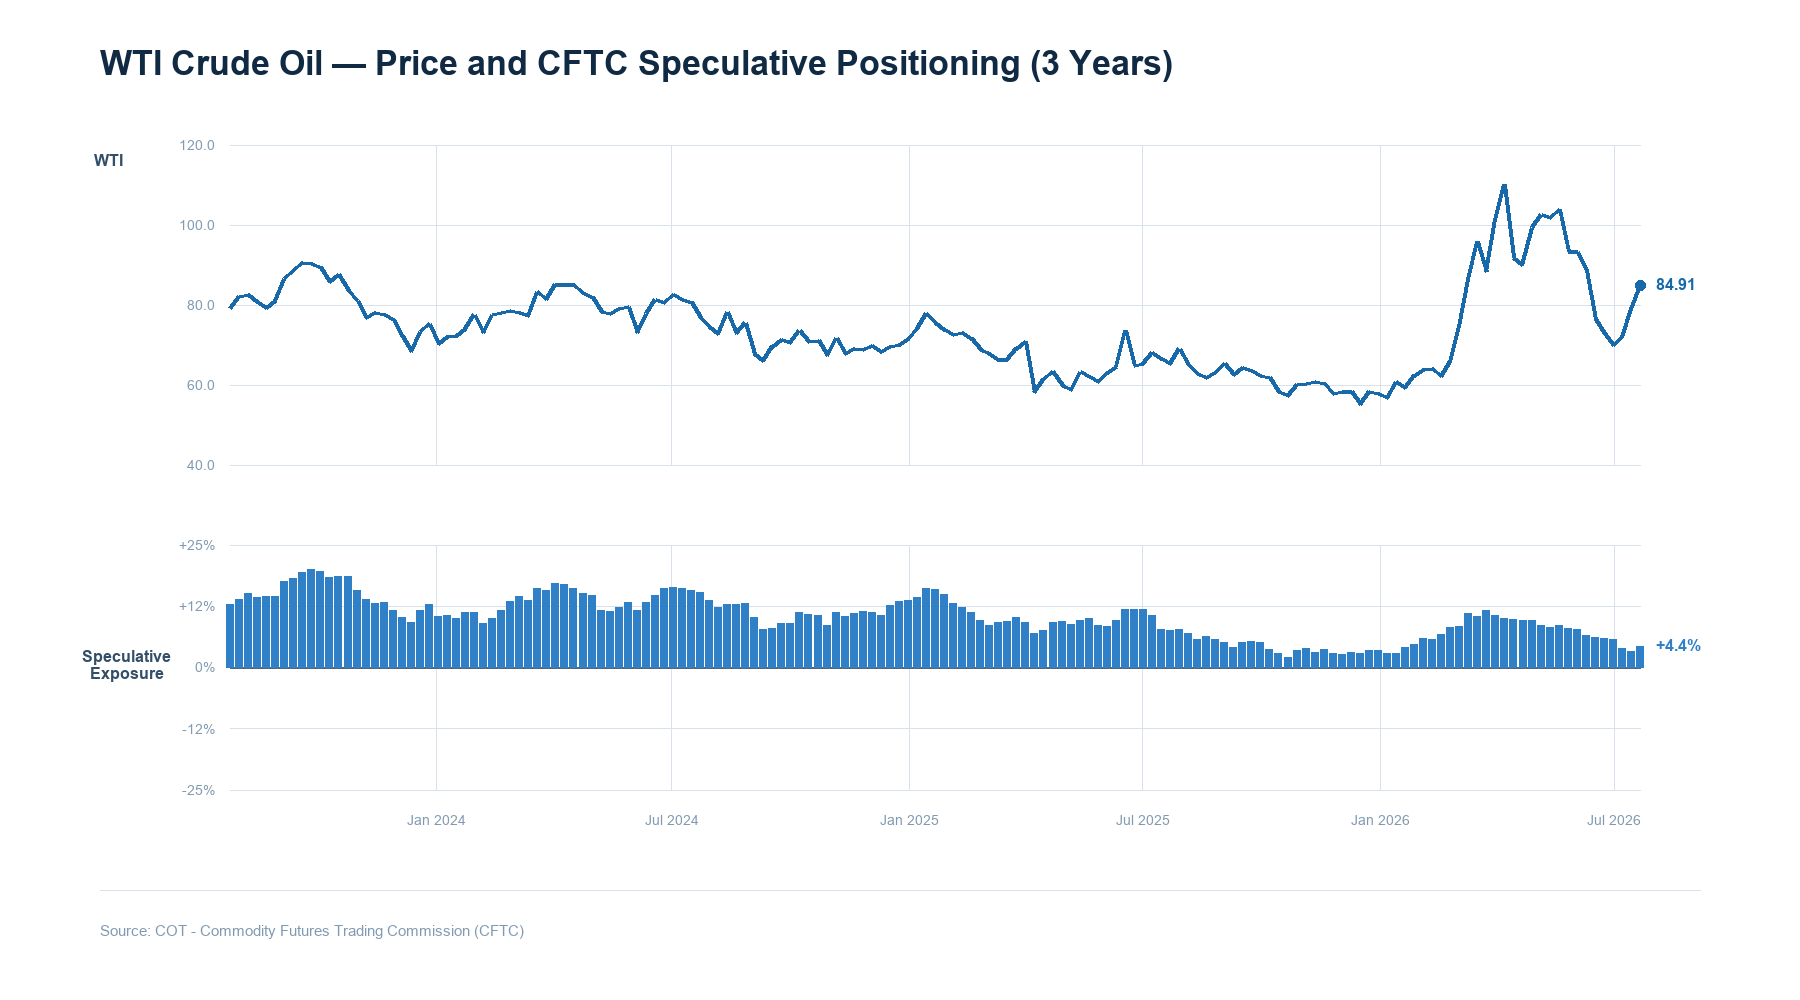
Non-commercial WTI net longs rose by nearly 38.5K contracts to around 120.1K contracts in the week to July 28, according to the Commodity Futures Trading Commission (CFTC). The improvement was predominantly due to short covering: speculative shorts fell by roughly 33.6K contracts, while longs increased by around 4.8K contracts.
Even after that rebound, net positioning stood at only the 11.4th percentile of the last three years, while net speculative exposure was nearly 6.5%, hovering near the 13th percentile. Speculative traders are no longer positioned for an extreme collapse, but they are far from crowded long.
A credible peace agreement may still trigger fresh selling, but another breakdown in negotiations could force both renewed short covering and new long demand, amplifying the upside response.
WTI forecast: $77–$88 remains the most credible near-term range
The evidence favours a range-based forecast rather than a single target. Geopolitical headlines can move the front contract by several dollars before inventory or production data have time to matter. The curve, however, argues against treating every peace headline as confirmation of a lasting surplus.
Scenario | WTI range | Principal trigger | Market implication |
Bearish normalisation | $68-$75 | Verified agreement and sustained recovery in Gulf shipping and exports | Geopolitical premium fades, and the curve flattens sharply |
Base case | $77-$88 | Negotiations remain inconclusive, while physical flows recover only gradually | Headline-driven range with continued backwardation |
Renewed disruption | $92-$105 | Fresh strikes, tanker disruption or a material decline in Gulf exports | Short covering and prompt scarcity reinforce the rebound |
The bottom line
WTI near $80 is no longer carrying the full panic premium seen during the latest escalation, but the market has not returned to normal. The steep backwardation, depleted Cushing stocks and low speculative percentiles suggest that the downside from peace headlines may be slower and more orderly than the upside from another physical disruption.
For now, the most likely outcome is a choppy trade between $77 and $88. A sustained break below that range would require verifiable evidence that Gulf shipping and exports are normalising. A break above it would become likely if negotiations fail and physical flows deteriorate again.
Author

Pablo Piovano
FXStreet
Born and bred in Argentina, Pablo has been carrying on with his passion for FX markets and trading since his first college years.














