The Semiconductor rally is progressing: The low 5,000s should be next

In our previous update from May 2nd, when the Semiconductor Index (SOX) was trading around $4430, we continued with our analyses based on the Elliott Wave (EW) Principle and concluded,
“In the short term, we expect the upside to ideally reach $4550-5090, depending on which Fibonacci extension is operable (c=a to c=1.618x a, see Figure 1), and contingent upon holding above $3963.”
Fast-forwarding, the index reached $4996 last week and is currently trading at $4865- a 10% gain that was easily secured. Since our EW count has kept us on the right track, we must continue to apply it. Refer to Figure 1 below. Additionally, we can enhance our analysis with three more weeks of price data.
Figure 1
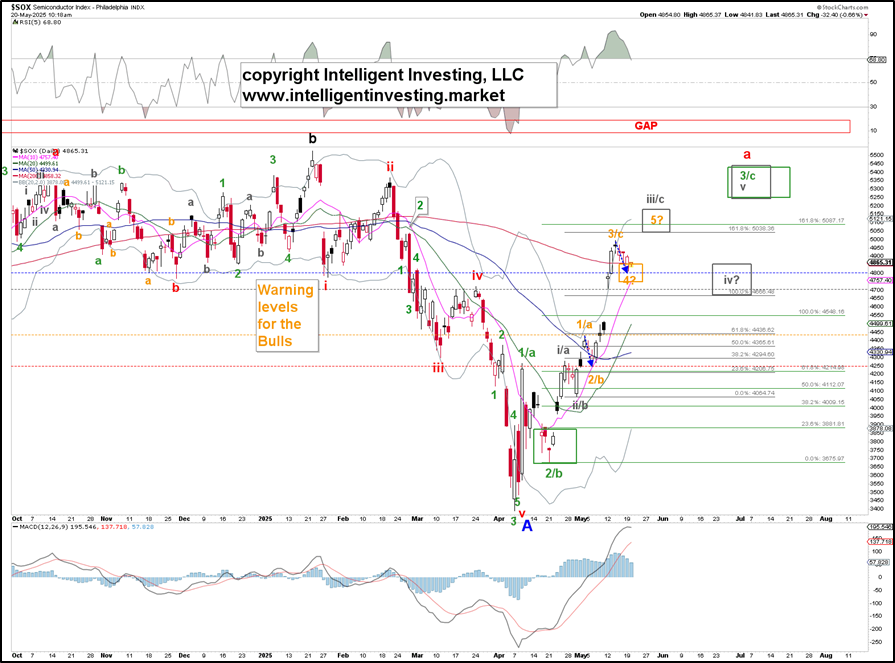
Since we cannot know in advance whether a move will consist of three (abc, corrective) or five (12345, impulse) waves, we must begin by labeling each wave as 1/a, 2/b, 3/c, and so on. However, because financial markets generally trend upward over the long term through an impulse, we typically prefer five waves until proven otherwise, such as breaks below our colored warning levels.
Moreover, financial markets are fractal, and consequently, larger waves subdivide into smaller waves, which can, in turn, subdivide. Thus, the SOX has completed the orange W-3/c of the grey W-iii/c of the green W-3/c of the red W-a. See Figure 1 above. Assuming five orange waves upward from the late-April grey W-ii/b low, the index should now be in the orange W-4, followed by orange W-5, ideally reaching $5150+/-50, etc. This is all contingent on the index holding above at least last Monday’s low (~$4700) and especially above the orange W-1/a high at ~$4430.
With the added price data, we can provide a more detailed update on our overall EW count for the SOX, which currently places the index in a Cycle-4 wave. See Figure 2 below. Fourth waves are typically described in EW terminology as flat corrections. Furthermore, EW theory includes a rule of alternation: Wave 4 differs from Wave 2. In this context, Cycle W-2 was an extended nine-year zigzag; therefore, Cycle W-4 is expected to be a multi-year flat.
Figure 2
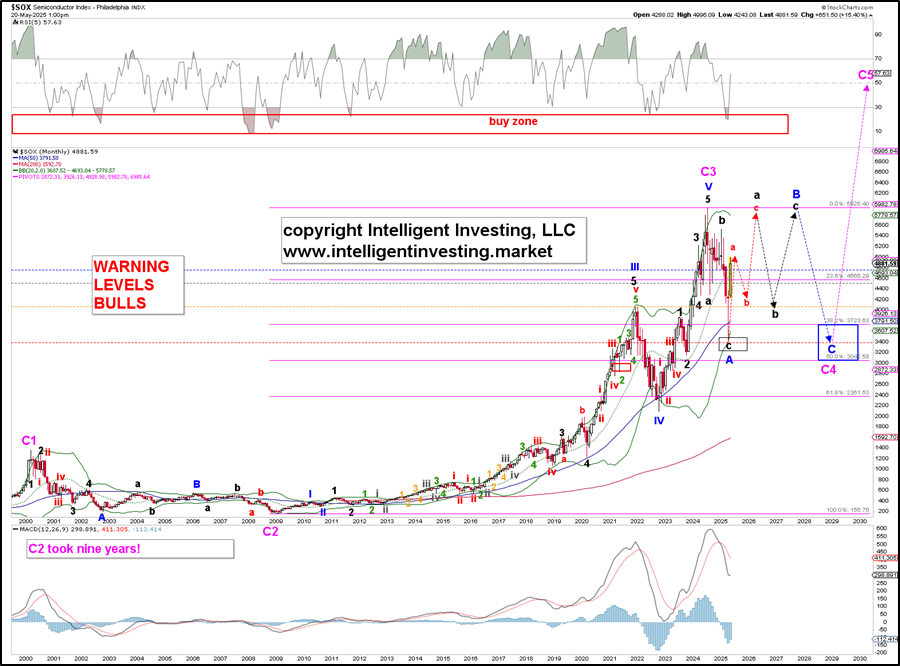
Flat corrections follow a 3-3-5 pattern (A-B-C = abc-abc-12345), where A is roughly equal to B and C in its simplest form. Consequently, the first leg (A = abc) is complete, as it ended right in the ideal target zone (black rectangle), and the second leg (B = abc) is currently in progress. Since A is roughly equal to B in this instance, we should anticipate the index to return to the $5000s, with a gap fill around $5700 as a potential target, following the indicated black dotted path.
Therefore, in the short term, spanning days to weeks, we expect the upward trend to persist, enabling us to raise our target range for the red W-a to $5090-5450, depending on how the waves will subdivide (threes vs. fives, see Figure 1), and contingent upon remaining above at least $4500. Once we reach the target zone for red W-a, we will monitor it daily for our premium members to identify that peak; afterward, we can more accurately evaluate where the red W-b might bottom before the red W-c ideally settles around ~$5700. However, the red W-b should hold the $4200+/-100 support-resistance zone for now.
Author

Dr. Arnout Ter Schure
Intelligent Investing, LLC
After having worked for over ten years within the field of energy and the environment, Dr.


