The Dow Jones Industrial Average is short its own war
- DJIA trades near 53,250, roughly 300 points lower, with the 53,500 shelf gone.
- One energy stock, 2.2% of the index, against more than a quarter in financials.
- September hike odds near 60%, up from 35% before Friday's keynote.

The Dow Jones Industrial Average (DJIA) trades near 53,250, roughly 300 points lower on the session on Monday, after American forces struck two Iranian rocket launchers on Larak Island and Tehran answered with attacks on bases in Jordan and assets in the United Arab Emirates. Crude Oil ran better than 2% higher through the $85.00 handle on the news, and Treasury yields rose alongside it rather than falling. A shock that lifts the barrel and the cost of money at once is not a risk-off event for this index. It is a tightening event.
The hedge that stopped working
The reflex on a Middle East escalation is to sell equities and buy government bonds, and Monday declined to follow it. Longer-dated Treasury yields pushed higher through the session, short-dated borrowing costs across Europe reached multi-year highs, and Japanese two-year paper touched a level last seen thirty-one years ago. Bonds sold on a war headline because this war is being priced as a cost story rather than a growth story.
The transmission is direct enough to trace. Disrupted traffic through the Strait of Hormuz raises the delivered cost of energy, energy runs straight into goods inflation, and the Federal Reserve chair used his first Jackson Hole keynote on Friday to say that better summer readings had not persuaded him that underlying trends were improving. The benchmark Gulf-to-Japan large tanker rate set a record above $107 per metric ton on August 27, which is a freight market pricing the risk rather than a headline market reacting to it.
Rate futures did the rest of the work. Pricing for a September increase sits near 60% against roughly 35% before Friday, a move that would take the target range to 3.75% to 4.00% and reverse the direction every equity model built over the past two years assumed. Nothing in Monday's headlines argues the other way, because the escalation and the inflation risk are the same trade.
One energy stock against a quarter of the index
Price weighting decides how that lands inside this particular average, and the arithmetic runs against it. Chevron (CVX) has been the only energy company in the index since ExxonMobil was removed in 2020, and at roughly 2.2% of index weight it is the whole of the hedge. Financials carry better than a quarter of the index across five names, with Goldman Sachs (GS) alone near 11.5% on a share price above $1,000.
The index is therefore structurally on the wrong side of its own geopolitical story, with barely two points of weight benefiting when a supply shock lifts the barrel and more than twelve times that much sitting in the block most exposed to a front end moving toward a hike. Alphabet (GOOGL) took Verizon's seat at the end of June, which stripped the last telecom ballast out of the average and replaced it with a name that trades on duration.
The same mechanism explains why August's technology rally largely passed the index by. Nvidia (NVDA) is worth roughly 2.4% here and Microsoft (MSFT) roughly 5.7%, so a month in which artificial intelligence names carried the broader benchmarks left this one on track for a fifth straight monthly advance and still some 3% beneath the record it set in the first week of August.
The numbers that carry the week
Friday's employment report is the advertised event, with August payrolls forecast at 58K after a 23K contraction, the unemployment rate held at 4.1%, and average hourly earnings accelerating to 0.3% MoM from 0.1%. The chair has already described the labour market as stable and consistent with full employment, and has said wage growth stopped being a reliable guide to future inflation a long time ago. Most of the policy content is drained out of that report before it prints.
The releases carrying an actual reaction function land earlier in the week. The Institute for Supply Management (ISM) manufacturing Purchasing Managers Index (PMI) arrives Tuesday at 14:00 GMT with the prices paid component forecast at 72 against 71.1 prior, and the services reading follows Thursday with its own prices paid line last at 70.3. Those two subindices are where an energy shock shows up first, and they measure the one variable the chair says has not improved.
Between them sit the private payroll estimate on Wednesday at 12:15 GMT, forecast at 47K against 44K, and the Beige Book at 18:00 GMT the same day. The decision lands September 16, and with three policymakers scheduled to speak before Friday, the tone that moved the front end last week has more room to be reinforced than walked back.
Levels to watch
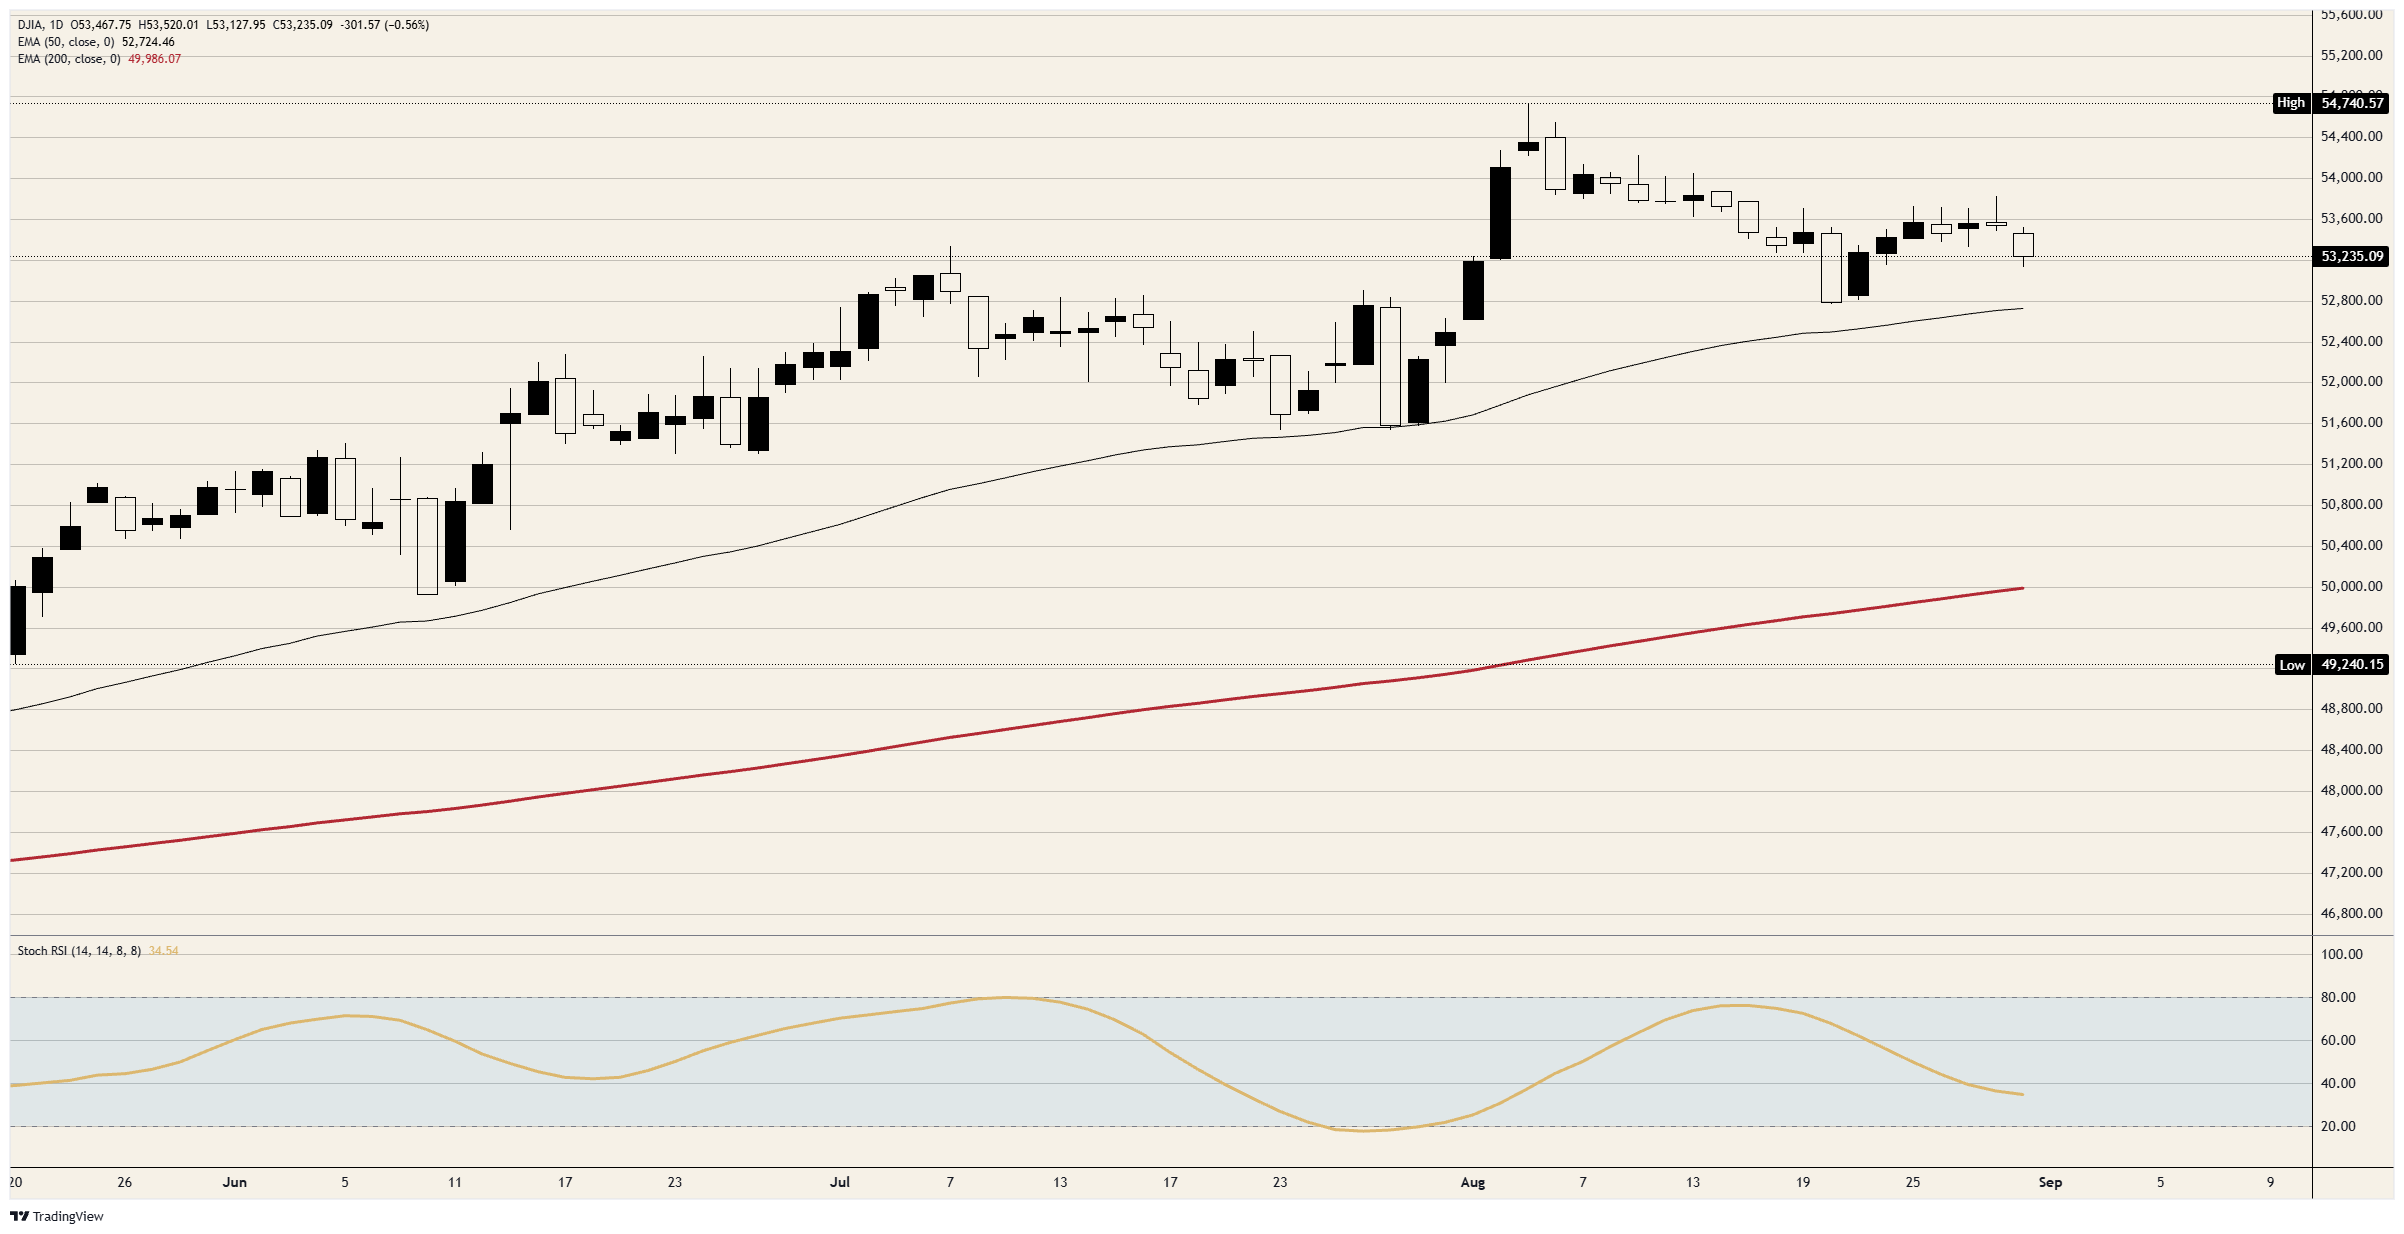
Resistance: The 53,500 handle turned the session high back and now caps what it supported last week. Above it the band just above 53,800 has rejected every attempt since mid-month, with 54,000 and the record just short of 54,750 beyond.
Support: The session floor sits in the 53,100 area, with the 53,000 handle the next shelf beneath it. Below there the rising 50-day Exponential Moving Average (EMA) near 52,700 is the line the August advance was built on, and the 200-day EMA near 50,000 is nowhere near play.
Bias: Bearish while 53,500 caps, with objectives at the 53,000 handle and then 52,700. The daily Stochastic Relative Strength Index (Stoch RSI) near 35 is falling through the lower half of its range with no divergence to argue against it. Invalidation on a daily close above 53,800.
Dow Jones daily chart
Dow Jones FAQs
The Dow Jones Industrial Average, one of the oldest stock market indices in the world, is compiled of the 30 most traded stocks in the US. The index is price-weighted rather than weighted by capitalization. It is calculated by summing the prices of the constituent stocks and dividing them by a factor, currently 0.152. The index was founded by Charles Dow, who also founded the Wall Street Journal. In later years it has been criticized for not being broadly representative enough because it only tracks 30 conglomerates, unlike broader indices such as the S&P 500.
Many different factors drive the Dow Jones Industrial Average (DJIA). The aggregate performance of the component companies revealed in quarterly company earnings reports is the main one. US and global macroeconomic data also contributes as it impacts on investor sentiment. The level of interest rates, set by the Federal Reserve (Fed), also influences the DJIA as it affects the cost of credit, on which many corporations are heavily reliant. Therefore, inflation can be a major driver as well as other metrics which impact the Fed decisions.
Dow Theory is a method for identifying the primary trend of the stock market developed by Charles Dow. A key step is to compare the direction of the Dow Jones Industrial Average (DJIA) and the Dow Jones Transportation Average (DJTA) and only follow trends where both are moving in the same direction. Volume is a confirmatory criteria. The theory uses elements of peak and trough analysis. Dow’s theory posits three trend phases: accumulation, when smart money starts buying or selling; public participation, when the wider public joins in; and distribution, when the smart money exits.
There are a number of ways to trade the DJIA. One is to use ETFs which allow investors to trade the DJIA as a single security, rather than having to buy shares in all 30 constituent companies. A leading example is the SPDR Dow Jones Industrial Average ETF (DIA). DJIA futures contracts enable traders to speculate on the future value of the index and Options provide the right, but not the obligation, to buy or sell the index at a predetermined price in the future. Mutual funds enable investors to buy a share of a diversified portfolio of DJIA stocks thus providing exposure to the overall index.
Author

Joshua Gibson
FXStreet
Joshua joins the FXStreet team as an Economics and Finance double major from Vancouver Island University with twelve years' experience as an independent trader focusing on technical analysis.