|

The climatic run in SP 500: Topping pattern or sign of strength? [Video]

Was the climatic run in S&P 500 after the FOMC last week a topping pattern or a sign of strength?

Watch the video below to find out how to use the Wyckoff method with volume spread analysis to interpret the price action, the key levels to validate the bullish scenario and the target price for S&P 500.

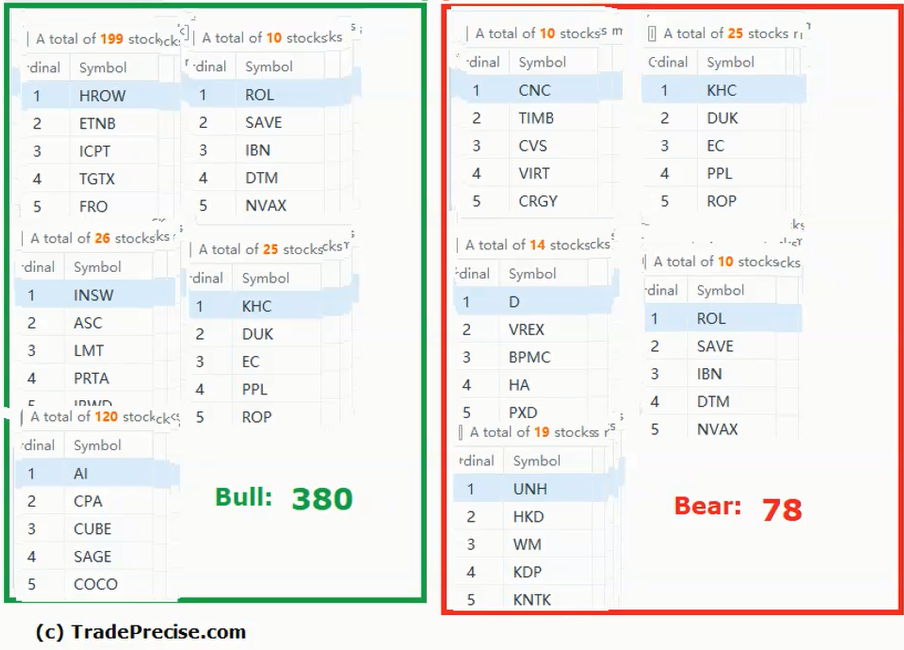
The bullish setup vs. the bearish setup is 380 to 78 from the screenshot of my stock screener below suggested a positive market environment.

Wyckoff method stock screener

Watch out for a successful test as discussed in the video above before the next rally up.

It is better to wait for a pullback for entry setup rather than chasing the extended run for some outperforming stocks as discussed in the live session.

Author

Ming Jong Tey

Ming Jong Tey

Independent Analyst

Ming Jong Tey has been trading since 2008. He started his learning journey from technical analysis (indicators, Fibonacci, etc...) to value investing. Throughout his journey, he develops an interest in price action with chart pattern trading.

More from Ming Jong Tey
Share:

Editor's Picks

EUR/USD stabilizes near 1.1800 as markets focus on geopolitics

EUR/USD stays defensive around 1.1800 in the second half of the day on Thursday. The US Dollar stabilizes, following the recent decline led by tariff uncertainty, capping the pair's upside. All eyes now remain on the US-Iran nuclear talks after ECB President Lagarde's testimony failed to impress Euro bulls. 

GBP/USD drops toward 1.3500 as USD finds fresh demand

GBP/USD falls back toward 1.3500 in the European session on Thursday, snapping its recovery momentum. The pair loses traction as the US Dollar finds fresh demand, as markets turn cautious ahead of the US-Iran nuclear talks. The US trade policy uncertainty also remains a drag on risk sentiment. 

Gold clings to gains amid sustained safe-haven flows ahead of US-Iran talks

Gold sticks to its modest intraday gains through the first half of the European session on Thursday, with bulls still awaiting a sustained move and acceptance above the $5,200 mark before placing fresh bets. 

Stellar: Relief bounce fades as bearish undertone persists

Stellar is trading around $0.16 at the time of writing on Thursday after rebounding more than 8% in the previous day. Derivatives data paints a negative picture as XLM’s short bets hit a monthly high while Open Interest continues to decline.

The one thing everyone is on the lookout for is US action of some sort against Iran

The FX market is minestrone soup these days. It is befuddled by conflicting data, rumors and small stories exaggerated out of proportion, and Trump-generated uncertainty. 

Solana strikes key resistance with double-digit gains

Solana trades at $88 at press time on Thursday, after an 11% upswing the previous day within a broader consolidation range of roughly three weeks. Institutional demand for Solana heightens as US spot SOL Exchange Traded Funds record $30 million of inflow on Wednesday.