|

Tesla: Pause before next break higher

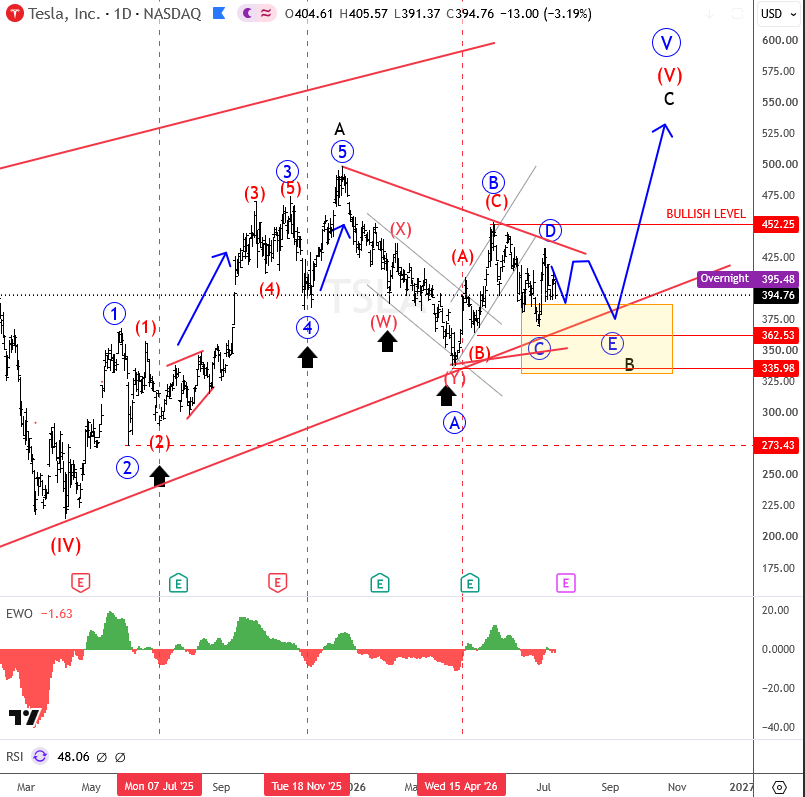
Tesla has seen a very nice recovery above the 436 level back in May, which we highlighted as an important level point for bullish continuation, because it clearly shows that bulls are still active, especially since the whole decline from the December highs into the April 2026 lows unfolded in seven swings, which is why we labeled it as a W X Y correction. However, notice that rebound from the 335 lows also then unfolded as corrective because we can count only three waves up so into 455, which makes the current structure quite tricky.
tesla
TSLA Daily Chart


It could mean that the higher degree wave B from the December highs is still underway and may unfold either as a flat or, but ideally its going to be triangle that could keep the market trapped in a range for now. For that reason, the support area around 334 to 362 could still be retested before the market attracts new buyers again, which we think could happen if the Elliott Wave Oscillator turns back above the zero line, suggesting that a new bullish sequence may be underway.

Highlights

  • Three waves upo from 335 to 455,and now new three legs down looks like a pause for Tesla.
  • Market may remain trapped in a larger flat or triangle consolidation.
  • Key support area to watch remains between 334 and 362.
  • Elliott Wave Oscillator can hint a possible new bullish sequence.

Get Full Access To Our Premium Elliott Wave Analysis For 14 Days. Click here.

Author

Gregor Horvat

Gregor Horvat

Wavetraders

Experience Grega is based in Slovenia and has been in the Forex market since 2003.

More from Gregor Horvat
Share:

Editor's Picks

AUD/USD holds steady near 0.7200 amid escalating US-Iran tensions

AUD/USD consolidates just below its highest level since mid-May, touched on Friday, and hovers around 0.7200 at the start of a new week amid mixed cues. Hawkish RBA expectations continue to act as a tailwind for the Aussie. Meanwhile, the upbeat US NFP report lifted Fed rate hike bets, which, along with escalating US-Iran tensions, underpins the safe-haven US Dollar and caps the currency pair.

USD/JPY collapses to seven-month lows near 154.00

USD/JPY extends its decline on Monday, sliding to the area of seven-month lows near the 154.00 neighbourhood, all amid an increasingly hawkish repricing of the BoJ’s policy outlook and repatriation chatter.

Gold bounces off lows, back above $4,400

Gold builds on Friday’s losses, although it manages to regain some composure and reclaim the $4,400 mark per troy ounce on Monday. The yellow metal’s decline follows the move lower in the Greenback and steady caution ahead of key US data releases toward the end of the week.

Bittensor: TAO eyes $300 amid launch on Raydium, parody meme coin, ChatGPT-6 Astra release

Bittensor is trading in the green on Monday, continuing a steady upward trend over the last five days, with a 25% gain. Social chatter surrounding Bittensor is increasing amid a similarly named meme coin launched on Solana and the release of ChatGPT-6 Astra. The technical outlook for TAO is bullish as momentum strengthens and buyers target the $300 breakout.

Strong US jobs, Middle East tensions and key inflation data ahead
Good morning all, hope you enjoyed your weekend. Markets are starting the week after Friday’s stronger-than-expected US jobs report, which increased expectations that the Fed could raise rates at its September meeting. However, US markets are closed today for the Labor Day holiday, so liquidity should be lower and we may see slower price action.
Diesel’s record $100 warning: The oil shock hiding in plain sight

The Oil market may look calmer than it did a few months ago, but diesel is sending a very different message. The US diesel crack spread, the premium of ultra-low sulphur diesel futures over WTI, recently surged above $100 per barrel for the first time, reaching an intraday record of just over $102.00.
















