TATA Consumer Product Elliott Wave technical analysis [Video]
![TATA Consumer Product Elliott Wave technical analysis [Video]](https://editorial.fxstreet.com/images/TechnicalAnalysis/ChartPatterns/Candlesticks/high-resolution-stock-exchange-evolution-panel-55741904_XtraLarge.jpg)
TATACONSUM Elliott Wave technical analysis
-
Function: Larger Degree Trend Higher (Intermediate degree, orange).
-
Mode: Motive.
-
Structure: Impulse.
-
Position: Minor Wave 4.
-
Details: Minor Wave 4 might have unfolded as a combination, terminating around the 1000 mark. If this is accurate, Minor Wave 5 should be underway shortly.
-
Invalidation Point: 845.
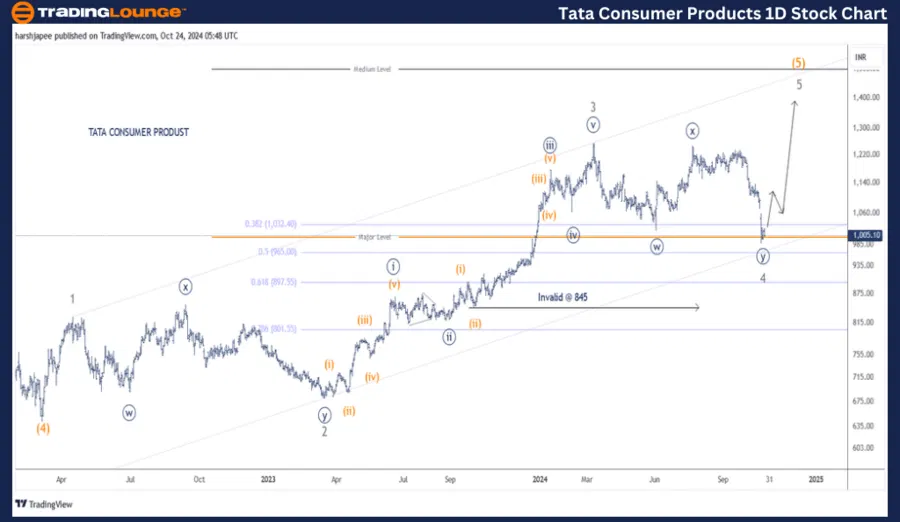
TATA Consumer Product - Daily chart technical analysis and potential Elliott Wave counts
The TATA Consumer Product daily chart suggests a continued rally as Intermediate Wave (5) Orange unfolds. The stock looks set to push through the 1255 mark as Minor Wave 5 Grey begins to develop from levels below 1000.
Intermediate Wave (4) Orange was completed around the 640 levels in March 2022. Since then, Minor Waves 1 through 4 may have reached or are nearing completion. Note that the wave counts have been adjusted from our last update, with Minor Wave 4 now marked as a combination.
Additionally, the Fibonacci 0.50 retracement and channel support confirm the potential termination of Wave 4 around the 1000 mark. If this is correct, Wave 5 Grey should continue its upward movement, aiming to breach the 1255 mark.
TATACONSUM Elliott Wave technical analysis
-
Function: Larger Degree Trend Higher (Intermediate degree, orange).
-
Mode: Motive.
-
Structure: Impulse.
-
Position: Minor Wave 4.
-
Details: Minor Wave 4 might have unfolded as a combination, terminating around the 1000 mark. A Minute ((w)) - ((x)) - ((y)) structure has been identified, confirming a 3-3-3 pattern. If accurate, Minor Wave 5 should soon begin.
-
Invalidation Point: 845.
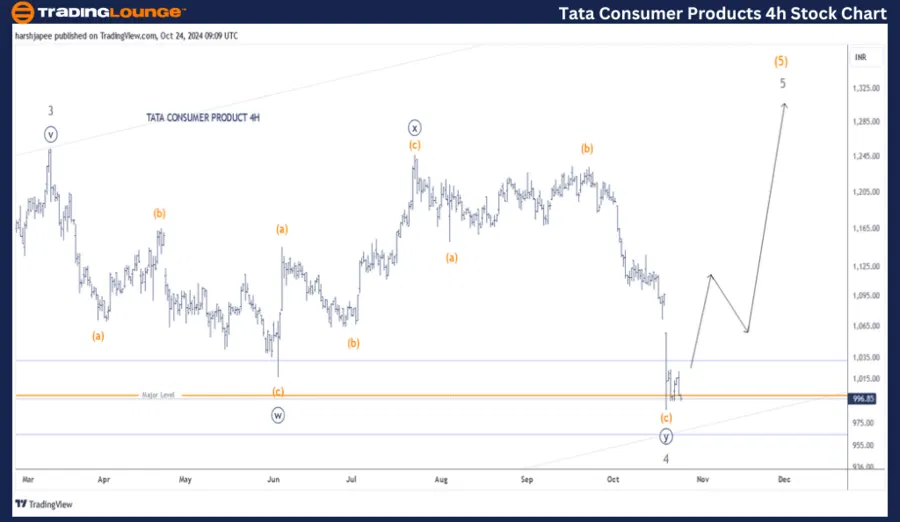
TATA Consumer Product - Four-hour chart technical analysis and potential Elliott Wave counts
The 4H chart for TATA Consumer Product highlights the sub-waves between Minor Wave 3 and 4 Grey. This structure is identified as a 3-3-3 pattern, labeled as Minute Waves ((w)) - ((x)) - ((y)), between the 1255 and 990 levels. If this pattern holds, the stock should rally from its current position as Minor Wave 5 begins to unfold.
Conclusion
TATA Consumer Product may have completed Minor Wave 4 around the 1000 mark as a combination. If this is accurate, Minor Wave 5 Grey should now be unfolding higher.
Tata Consumer Product Elliott Wave technical analysis [Video]
Author

Peter Mathers
TradingLounge
Peter Mathers started actively trading in 1982. He began his career at Hoei and Shoin, a Japanese futures trading company.


