Swiss Market Index Elliott Wave technical analysis [Video]
![Swiss Market Index Elliott Wave technical analysis [Video]](https://editorial.fxstreet.com/images/Markets/Equities/DowJones/dow-jones-industrial-average-17339541_XtraLarge.jpg)
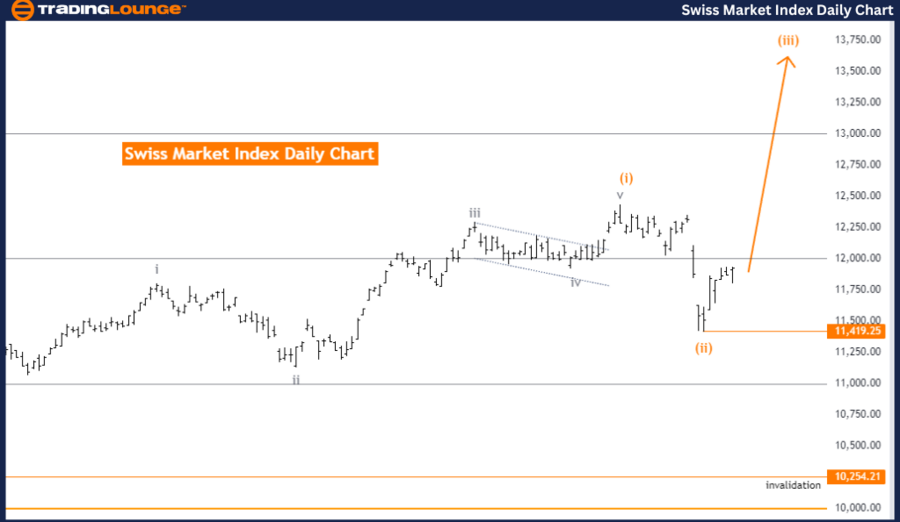
Swiss Market Index Elliott Wave Analysis Trading Lounge Day Chart
Swiss Market Index Elliott Wave technical analysis
-
Function: Trend.
-
Mode: Impulsive.
-
Structure: Orange Wave 3.
-
Position: Navy Blue Wave 3.
-
Direction next higher degrees: Orange Wave 3 (started).
-
Details: Orange Wave 2 of 3 appears complete, with Orange Wave 3 now in progress.
-
Wave cancel invalid level: 10254.21.
The Swiss Market Index (SMI) is currently exhibiting a trend mode with an impulsive structure, as revealed by the ongoing Elliott Wave analysis. The market is progressing through Orange Wave 3, which follows the completion of Orange Wave 2. This development suggests that the corrective phase associated with Wave 2 has concluded, and the index has now entered the more dynamic, upward phase of Orange Wave 3.
Currently, the SMI is positioned within Navy Blue Wave 3, which resides inside the larger Orange Wave 3. This indicates that the market is experiencing significant upward momentum. The ongoing Orange Wave 3 is expected to continue propelling the index higher, consistent with the impulsive nature of this trend. In Elliott Wave theory, Wave 3 is typically the most powerful and extended wave in the sequence, further indicating that the current upward movement is likely to persist.
The direction at the next higher degree remains focused on the continuation of Orange Wave 3, which has already commenced. This implies that the market is expected to maintain its upward trajectory within this wave, with the potential to reach new highs as the wave advances.
A crucial aspect of this analysis is the wave cancellation invalid level, established at 10254.21. This level serves as a critical threshold for validating the current wave structure. Should the SMI fall below this level, it would invalidate the present wave count, signaling a potential reversal or significant correction in the market.
In summary: The SMI is currently in an impulsive trend mode within Orange Wave 3, following the completion of Orange Wave 2. The index is positioned within Navy Blue Wave 3, with continued upward momentum anticipated. The wave cancel invalid level at 10254.21 is key for confirming the ongoing bullish trend.
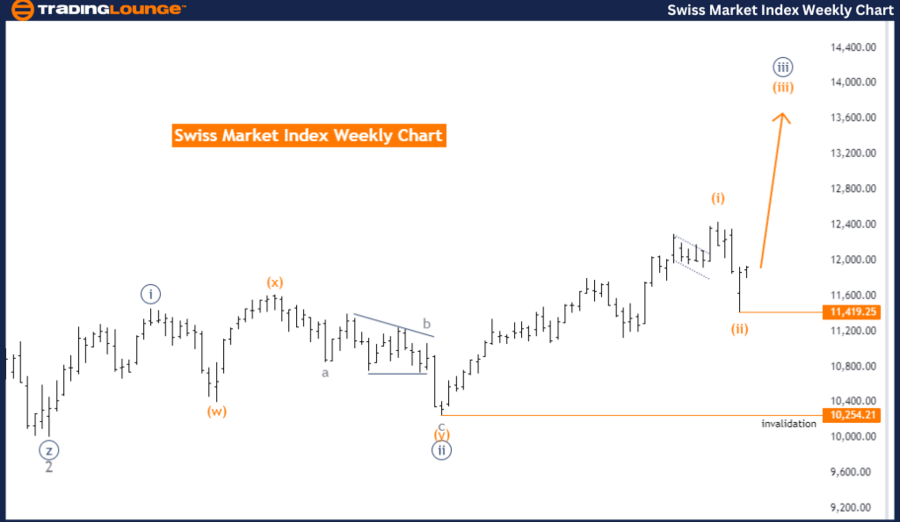
Swiss Market Index Elliott Wave Analysis Trading Lounge Weekly Chart
Swiss Market Index Elliott Wave technical analysis
-
Function: Trend.
-
Mode: Impulsive.
-
Structure: Orange Wave 3.
-
Position: Navy Blue Wave 3.
-
Direction next higher degrees: Orange Wave 3 (started).
-
Details: Orange Wave 2 of 3 appears complete, with Orange Wave 3 now in progress.
-
Wave cancel invalid level: 10254.21.
The Swiss Market Index (SMI) is currently following a trend mode within the Elliott Wave framework, characterized by an impulsive movement. The ongoing analysis identifies the market structure as being in Orange Wave 3, which follows the completion of Orange Wave 2. This indicates that the correction phase associated with Wave 2 has concluded, and the market is now advancing within the more aggressive, upward-moving Orange Wave 3.
Currently, the SMI is positioned in Navy Blue Wave 3 within the larger Orange Wave 3 structure. This positioning suggests that the index is experiencing significant upward momentum as it progresses through the impulsive Wave 3. In the context of Elliott Wave theory, Wave 3 typically represents the strongest and most extended phase of the market's movement, signaling continued bullish activity.
The analysis points to the continuation of Orange Wave 3 at the next higher degree, meaning the upward trend is expected to persist. Since Orange Wave 3 has already started, the market is anticipated to continue moving higher, potentially achieving new highs as this wave unfolds.
A critical component of this analysis is the wave cancel invalid level, set at 10254.21. This level acts as a key marker for validating the current wave structure. Should the SMI drop below this level, it would invalidate the present wave count, suggesting a potential reversal or significant correction in the market.
In summary: The SMI is in a trend mode with an impulsive structure within Orange Wave 3, following the completion of Orange Wave 2. The index is positioned in Navy Blue Wave 3, with expectations of continued upward momentum. The wave cancel invalid level at 10254.21 is crucial for confirming the ongoing bullish trend.
Technical analyst: Malik Awais.
Swiss Market Index Elliott Wave technical analysis [Video]
Author

Peter Mathers
TradingLounge
Peter Mathers started actively trading in 1982. He began his career at Hoei and Shoin, a Japanese futures trading company.


