Stocks: The question remains – Is this just a correction?

Stocks fluctuated on Thursday in a big way, with the daily trading range of the S&P 500 index exceeding 100 points. It closed 0.51% lower, indicating ongoing uncertainty and a generally bearish bias. This morning, the S&P 500 is expected to open 0.7% higher following the Core PCE Price Index release, which came in at +0.2% m/m – as expected. Is the market forming a bottom pattern? It might be, but given the clear downtrend, the recent fluctuations are likely just a consolidation before another leg lower. We’re awaiting crucial earnings data next week and the important FOMC Rate Decision on Wednesday.
My speculative short position in S&P 500, opened on July 9 at 5,636 remains profitable.
Investor sentiment has worsened, as indicated by the Wednesday’s AAII Investor Sentiment Survey, which showed that 43.2% of individual investors are bullish, while 31.7% of them are bearish – up from 23.4% last week.
As I mentioned in my stock price forecast for July, “While more advances remain likely, the likelihood of a deeper downward correction also rises. Overall, there have been no confirmed negative signals so far, but the May gain of 4.8% and June gain of 3.5% suggest a more cautionary approach for July (…) The market will be waiting for the quarterly earnings season in the second half of the month. Plus, there will be a series of economic data, including the CPI release on July 11, the Advance GDP number on July 25, and the FOMC Rate Decision on July 31.”
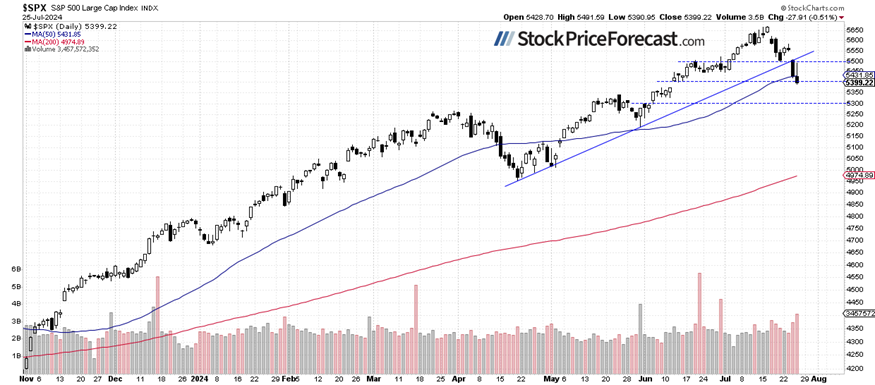
The S&P 500 index reached a new local low yesterday, approaching the important 5,400 level, as we can see on the daily chart.
Nasdaq 100 keeps selling off
The technology-focused Nasdaq 100 index lost 1.06% yesterday, following a 3.7% sell-off on Wednesday. It is leading the market lower after earnings releases from GOOG and TSLA. Next week, we will see more big-tech releases, including AAPL on Thursday. However, the Nasdaq 100 may be nearing a short-term local bottom and might see a consolidation or rebound soon.
On the previous Thursday, I concluded that “There are short-term overbought conditions, and the market is likely to top at some point.” This proved accurate with the recent sharp downward reversal and a sell-off that continued this week.

VIX: New highs
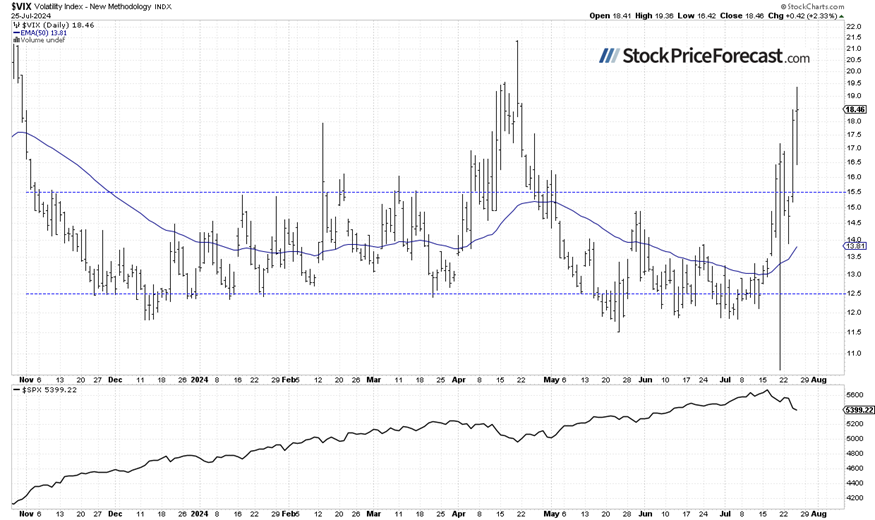
The VIX index, a measure of market fear, has been hovering around the 12-13 level since May. Last week, it was reaching 17, and yesterday, it was as high as 19.36, confirming the downtrend in stocks. (The chart seems to have a glitch with the lowest reading below 11 on Friday).
Historically, a dropping VIX indicates less fear in the market, and rising VIX accompanies stock market downturns. However, the lower the VIX, the higher the probability of the market’s downward reversal. Conversely, the higher the VIX, the higher the probability of the market’s upward reversal.
Futures contract: Volatility
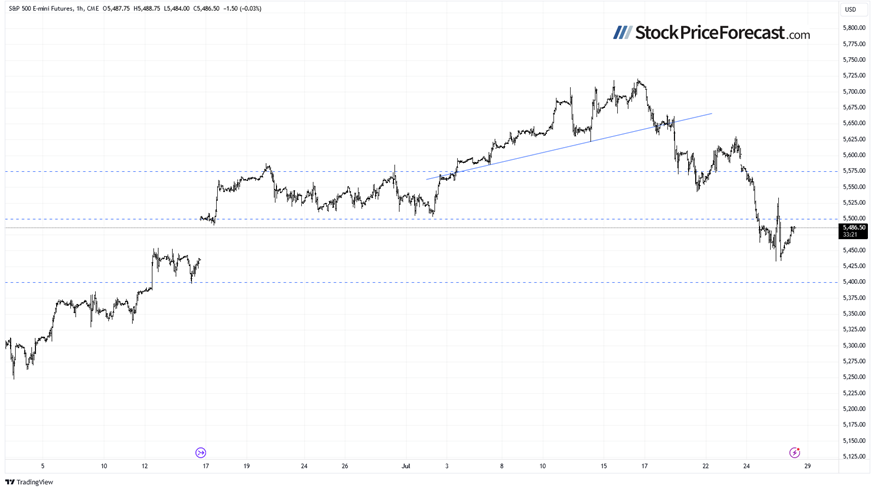
Let’s take a look at the hourly chart of the S&P 500 futures contract. This morning, it is rebounded from a low of around 5,430. The market fluctuated, reaching a local high of around 5,533 before returning to 5,430. This may indicate a balance between buyers and sellers and potentially the formation of a short-term bottom. The support level remains at 5,430-5,450, and the resistance level is at 5,500-5,520.
Conclusion
Friday’s trading session will likely bring more uncertainty to the stock market. Next week will be important, with earnings releases and the Fed's decision on Wednesday. This week’s sell-off raises questions: Was it just a correction? Or was it the beginning of a downtrend? Seasonal patterns suggest that the low is likely to happen in October, but the future does not always follow the past. For now, it looks like a downtrend, and in the short term, an upward correction may occur.
My speculative short position in the S&P 500 futures contract, opened on July 9 at 5,636, has become more profitable.
Quoting my stock price forecast for July, “Investors continue pricing in the Fed’s monetary policy easing that is supposed to happen this year. Hence, a medium-term downward reversal still seems a less likely scenario. However, the recent record-breaking rally may be a cause for some short-term concern as a downward correction may be coming.”
For now, my short-term outlook remains bearish.
Here’s the breakdown:
-
The S&P 500 index has slightly extended its downtrend and may be forming a bottoming pattern before an upward correction.
-
Investors are waiting for more quarterly earnings releases from big-techs next week.
-
In my opinion, the short-term outlook is bearish.
Want free follow-ups to the above article and details not available to 99%+ investors? Sign up to our free newsletter today!
Want free follow-ups to the above article and details not available to 99%+ investors? Sign up to our free newsletter today!
Author

Paul Rejczak
Gold Price Forecast
Paul Rejczak is a stock market strategist who has been known for the quality of his technical and fundamental analysis since the late nineties.


