Stocks and yields signal trouble as VIX approaches key resistance

Rising volatility, declining Treasury yields, and fading equity rebound signal trouble ahead for Nasdaq, S&P 500, and Dow.
Overview
The Volatility Index (VIX), commonly known as the market's "fear gauge," has reached a critical juncture, testing the pivotal 2-year support/resistance level at 18-80. Following a dramatic 40% decline from its recent high of 29-20 to 17-32, the VIX has established a symmetrical triangle pattern, indicative of an imminent breakout. Major U.S. indices, including Nasdaq, S&P 500, Dow futures, and the 10-year Treasury yield, are retreating from recent rebounds, which increasingly resemble a classic "dead cat bounce" rather than a sustainable recovery.
The alignment of these indicators suggests the market sentiment remains fragile, raising the probability of further downside momentum.
Fundamental context: Yields, stocks, and VIX connection
The relationship between U.S. Treasury yields, equity markets, and the VIX is traditionally inverse but occasionally synchronized during uncertain times. Rising yields typically pressure equity valuations by increasing borrowing costs and offering attractive bond alternatives. Conversely, falling yields normally signal economic caution or recession fears, prompting investors to sell equities and seek safer assets. The VIX rises as uncertainty and volatility escalate.
Currently, the unusual synchronization, where yields and stock indices are simultaneously pulling back after brief recoveries, reflects heightened uncertainty about the economic outlook, inflation trajectory, and Federal Reserve policy direction. With the VIX stabilizing at a crucial technical juncture, this synchronization points to investor anxiety resurfacing, hinting at the bearish continuation of stocks and possible yield declines.
Technical breakdown
Volatility index (VIX)
The VIX is testing critical resistance at 18-80 after rebounding from the 17-30 zone. A symmetrical triangle pattern has formed, signalling potential volatility expansion.
-
Immediate bullish scenario: Holding above 18-80 targets an initial rise toward 21-25 (triangle midpoint). A break above this level significantly increases the odds of a climb to 22-80 and subsequently to the triangle's upper boundary at 25-24. Beyond 25-24, the VIX could quickly escalate toward prior resistance zones at 26-75 and the recent high of 29-20.
-
Bearish scenario: A decisive break below 17-30 would temporarily alleviate bearish equity pressures, but remains unlikely in the current uncertain climate.

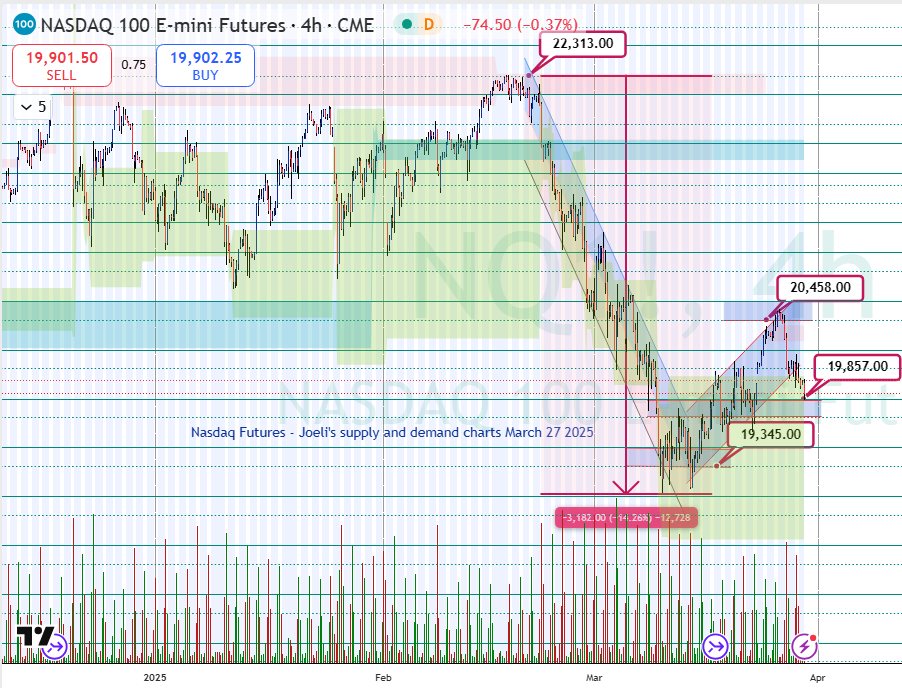
Nasdaq futures
The Nasdaq Futures' brief rebound from the critical 19345 support was decisively rejected at 20458, marking a continuation of bearish sentiment.
-
Current scenario: Now, testing immediate support at 19857 failure here opens the pathway downward to subsequent supports at 19716 and 19646, ultimately retesting the critical low at 19345.
-
Resistance levels: Clear resistance lies at 20458. Breaking this could temporarily shift sentiment but faces significant challenges amid rising volatility.
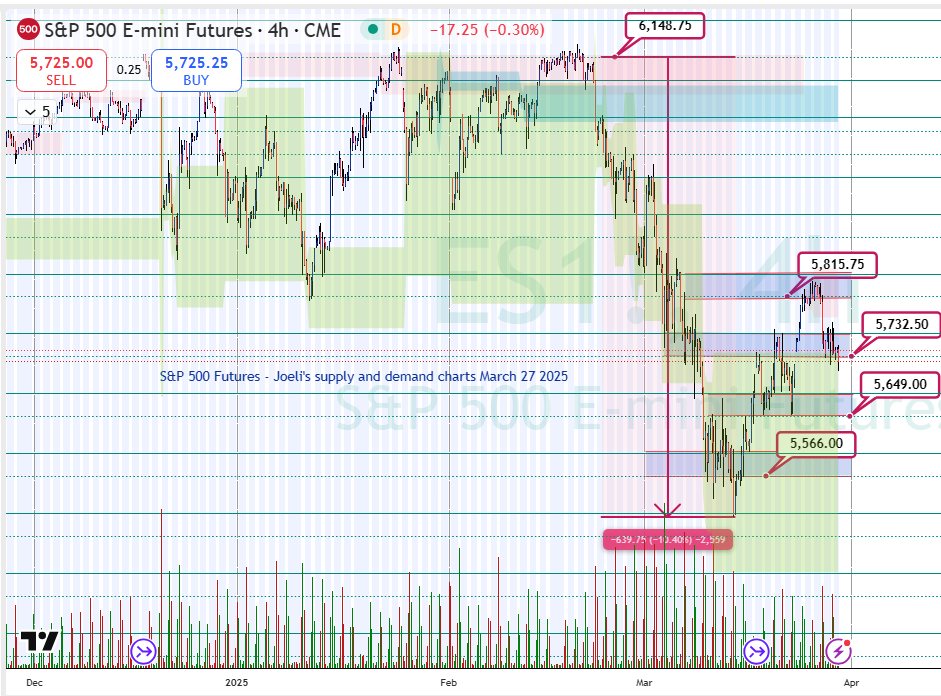
S&P 500 futures
The S&P 500 futures index has retraced approximately half its previous losses from a steep sell-off that began at 6148. After rejection at 5818, prices now hover precariously above critical Support at 5732.
-
Immediate support test: Failure at 5732 would trigger additional bearish pressure toward the next support levels at 5649 and 5566.
-
Bullish reversal potential: Only a decisive close above 5818 would suggest a more constructive outlook, which currently appears improbable amid elevated VIX levels.
Dow Jones futures
Dow futures also reflect weak momentum, retreating after a 50% retracement of the prior 9% decline from 45075 to 40707, facing rejection at 43083.
-
Critical Supports: The immediate focus lies on 42416; failing this Support will accelerate losses to subsequent supports at 42214 and the critical 41882 level.
-
Resistance Levels: Strong overhead resistance at 42546, 42750, and notably at 42878.

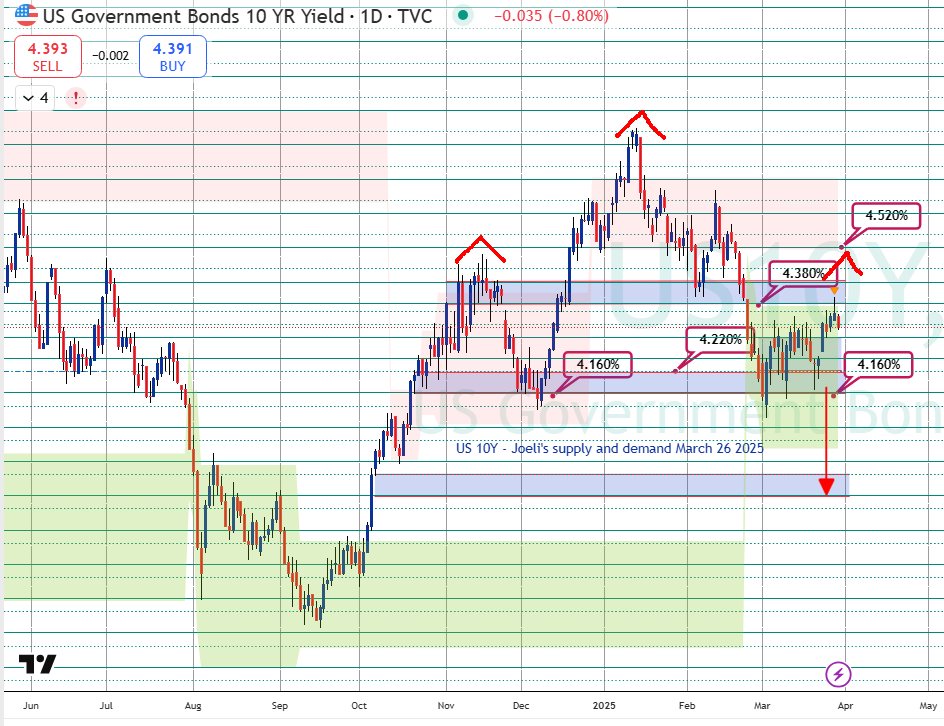
10-year treasury yield
The 10-year Treasury yield recently failed at the critical resistance level of 4.38%, previously highlighted as a significant pivot. On the daily chart, the yield formation now resembles a potential head-and-shoulders reversal pattern, which would have profound implications if completed.
-
Immediate supports: Crucial Support lies at 4.30, followed closely by 4-22 and 4.16. A breakdown through these levels would solidify a bearish reversal, targeting declines to the psychological levels at 4.00% and potentially down to 3.90%.
-
Yield consequences: A substantial yield decline typically signals mounting recession fears, negatively affecting investor confidence, driving volatility (VIX) higher, and accelerating equity market losses.
Consequences and market implications
The synchronized pullback across yields, equity indices, and the bounce in VIX underscores broad market anxiety. The current technical and fundamental alignment significantly raises the likelihood of renewed volatility spikes and deeper corrections in equity markets. Investors are likely reacting to increasingly uncertain economic growth prospects, inflation persistence, and potential policy missteps by central banks.
A confirmed breakout in VIX above critical resistance at 18-80,21-25 would further exacerbate bearish sentiment, driving equities lower and potentially pushing yields downward, reflecting deteriorating confidence in economic stability.
Conclusion
The market stands at a critical crossroads, with VIX's next move likely to be the catalyst for equity and bond market direction. Investors should closely monitor VIX's key levels at 18-80 and 21-25, as decisive movements will set the tone for broader market sentiment and direction. The current alignment indicates bearish pressures remain dominant, cautioning investors to brace for heightened volatility and downside risks ahead.
Author

Denis Joeli Fatiaki
Independent Analyst
Denis Joeli Fatiaki possesses over a decade of extensive experience as a multi-asset trader and Market Strategist.


